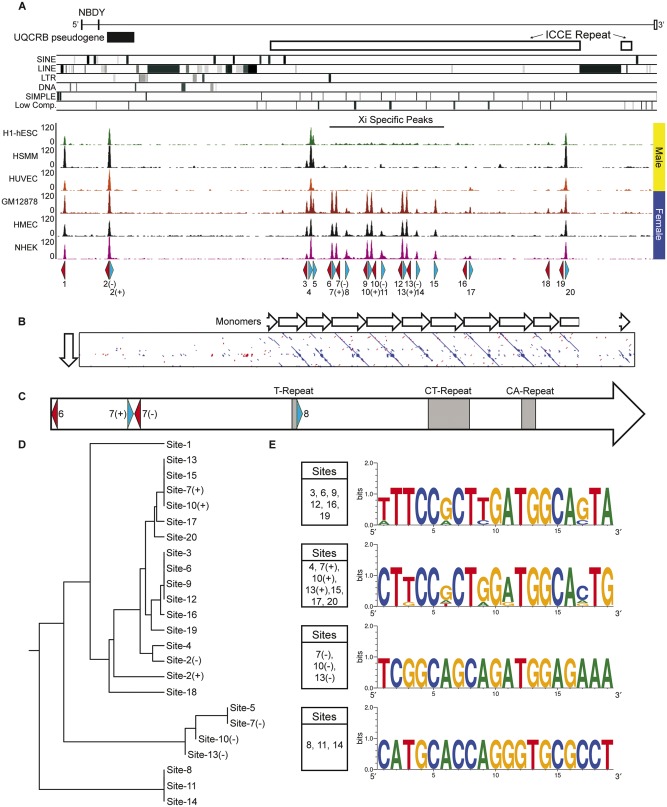
Fig. 5.
—Characterization of CTCF sites within the human NBDY locus. (A) Schematic map of the human NBDY locus showing the location of NBDY exons, the UQCRB pseudogene, the ICCE tandem repeat and the location of various repeat elements at hg19 chrX: 56, 752, 065-56, 844, 234. Beneath this are human CTCF ChIP-Seq profiles for three male samples (H1-hESC, human embryonic stem cell line H1; HSMM, skeletal muscle myoblasts; HUVEC, umbilical vein endothelial cells) and three female samples (GM12878, EBV transformed B-lymphocytes; HMEC, mammary epithelial cells; NHEK, epidermal keratinocytes). Beneath the ChIP-Seq profile are annotated the location of predicted motifs 1–20 and their orientation (blue, forward; red, reverse). Two predicted motifs under a single peak are represented as (+) and (−) for forward and reverse. (B) Pairwise alignment of a single ICCE repeat monomer with the NBDY locus. White arrows represent adjacent monomers. (C) Schematic map of the single monomer from part-B above (corresponding to hg19 chrX: 56, 799, 632-56, 805, 033), showing location of CTCF motifs and microsatellite repeat elements. (D) Rooted phylogenetic tree with branch lengths derived using the DNA sequence of CTCF motifs from the interval by UPGMA. (E) Sequence logos of related CTCF motifs from the NBDY locus. The presence of an identical base at a particular location in a motif is represented by a single base, whereas variation between sites at a particular position in the motif shows two or more bases with relative frequency represented by the size of the height of the base.

