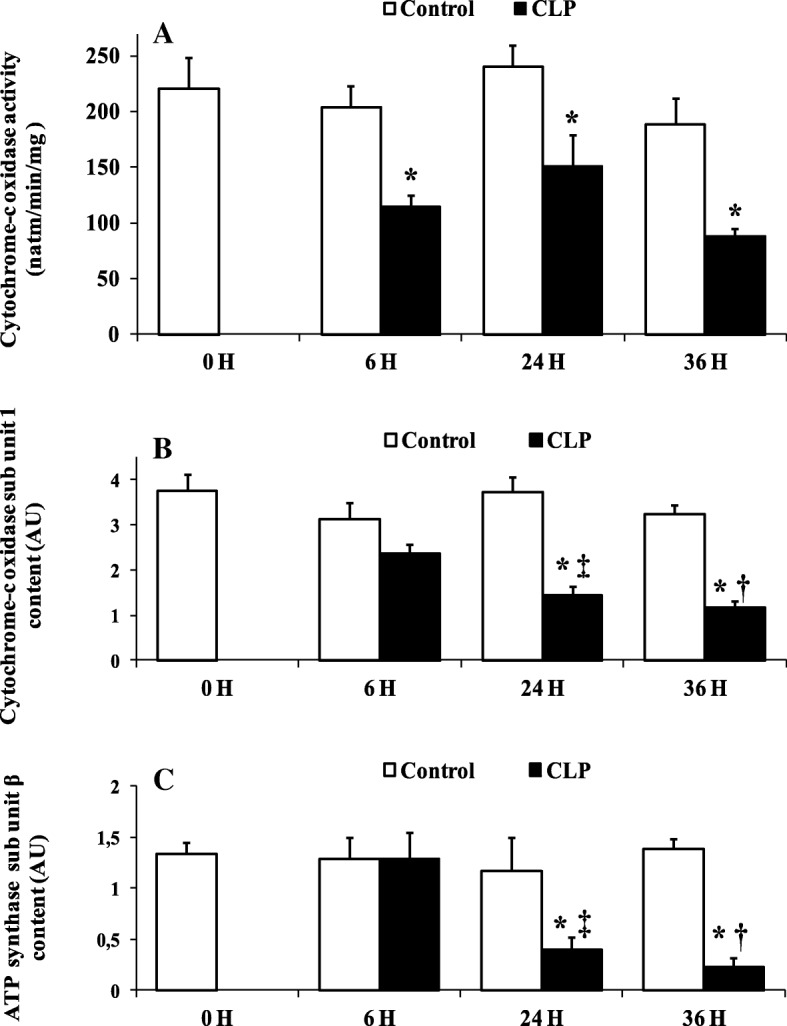
Fig. 3.

Cytochrome-c oxidase activity and sub unit 1 content, and ATP synthase sub unit β content. a Liver mitochondrial cytochrome c oxidase maximal activity of controls groups (naïve and sham-operated control) (white bars) and CLP groups (black bars). Data are means ± SEM. *p < 0.05 versus sham-operated and naïve rats from five animals per group determined by surgical procedure and following period (0, 6, 24, 36 h). Western blot analysis of liver mitochondrial cytochrome-c oxidase sub unit 1 (b), and ATP synthase sub unit β (c) in controls groups (white bars) and CLP groups (black bars). Data are means ± SEM. *p < 0.05 versus matching sham-operated control rats; ‡p < 0.05 compared 6 h CLP and 24 h CLP; †p < 0.05 compared 6 h CLP and 36 h CLP, from five animals per group determined by surgical procedure and following period (6, 24, 36 h)
