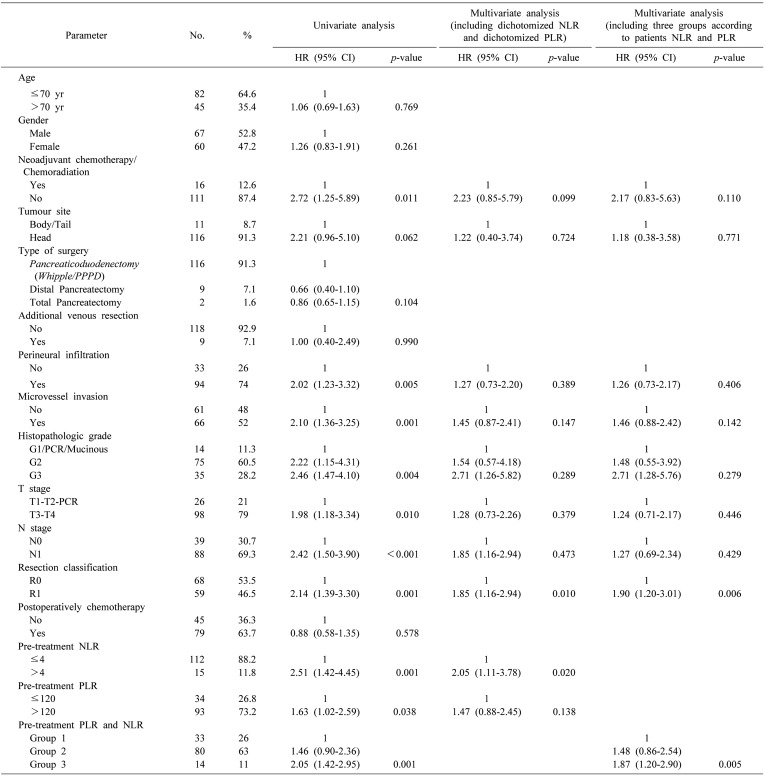
Table 2. Baseline clinicopathologic characteristics and their association with overall survival in univariate analysis and multivariate analysis.
HR, hazards ratio; CI, confidence interval; PCR, Pathologic Complete Response
Group 1, PLR≤120 and NLR≤4; Group 2, PLR>120 and NLR≤4 or PLR≤120 and NLR>4; Group 3, PLR>120 and NLR>4

