Figure 1.
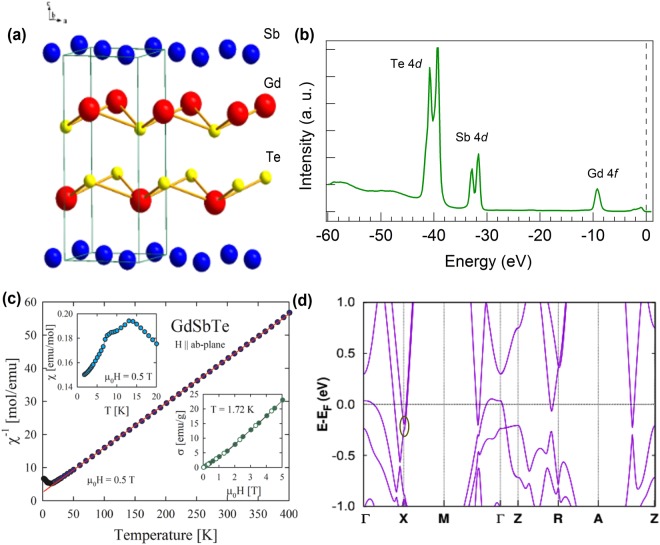
Crystal structure and sample characterization of GdSbTe. (a) Tetragonal crystal structure. Layers of Sb atoms form a square net. Sheets of Gd atoms are separated by two Te layers. (b) Core-level spectrum. Here, we clearly observe sharp peaks due to Te 4d (~40 eV), Sb 4d (~33 eV) and Gd 4 f (~8.5 eV) states. The black dashed line represents the Fermi level. (c) Temperature dependence of the reciprocal magnetic susceptibility measured in a magnetic field of 0.5 T applied within the crystallographic a-b plane. Solid line represents the fit of Curie-Weiss law to the experimental data. Upper inset: low-temperature magnetic susceptibility data. Lower inset: magnetic field variation of the magnetization taken at 1.72 K with increasing (full circles) and decreasing (open circles) magnetic field strength. (d) Ab-initio calculated bulk band structure along the high-symmetry directions. Red circle indicates the approximate position of the Dirac point.

