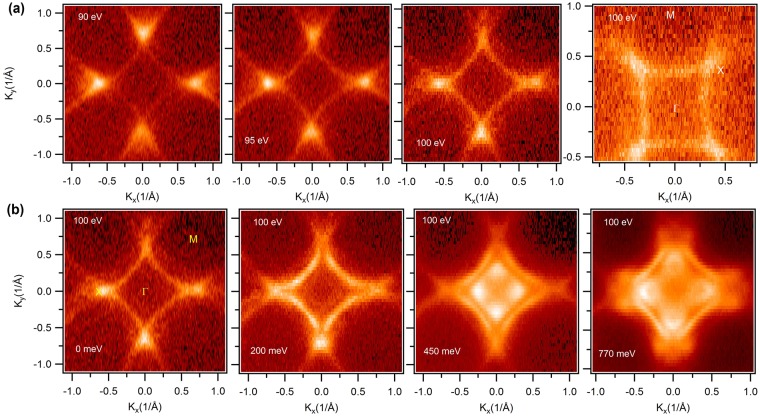
Figure 2.
Fermi surface and constant energy contour plots. (a) Experimentally measured Fermi surface maps at various photon energies and at different high symmetry directions. The rightmost panel represents the Fermi level in a different orientation with high symmetry points. Photon energies are noted in the plots. (b) Constant energy contour plots at various binding energies. Energies are noted in the plots. High symmetry points are indicated in the leftmost plot. All the measurements were performed at the ALS beamline 4.0.3 at a temperature of 21 K.

