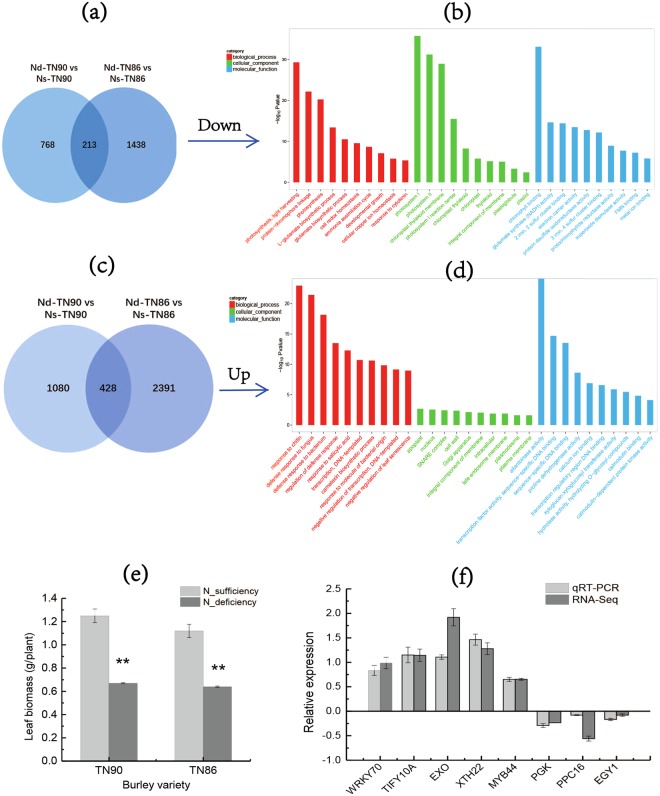
Figure 1.
Transcriptome analysis strategies and GO enrichment of target DEGs and leaf biomass (a) Venn diagram of down-regulated DEGs of deficient nitrogen condition vs sufficient nitrogen condition in TN90 and TN86 (b) GO enrichment in common down-regulated DEGs between TN90 and TN86 (c) Venn diagram of up-regulated DEGs of deficient nitrogen condition vs sufficient nitrogen condition in TN90 and TN86 (d) GO enrichment in common up-regulated DEGs between TN90 and TN86 (e) Leaf biomass (f) RNA-seq results confirmed by quantitative qRT-PCR. Nd-TN90: TN90 cultivated under deficient nitrogen condition; Ns-TN90: TN90 cultivated under sufficient nitrogen condition; Nd-TN86: TN86 cultivated under deficient nitrogen condition; Ns-TN86: TN86 cultivated under sufficient nitrogen condition. Error bars of leaf biomass indicate standard error of the means (n = 3). Error bars of qRT-PCR indicate standard error of the means (n = 6).

