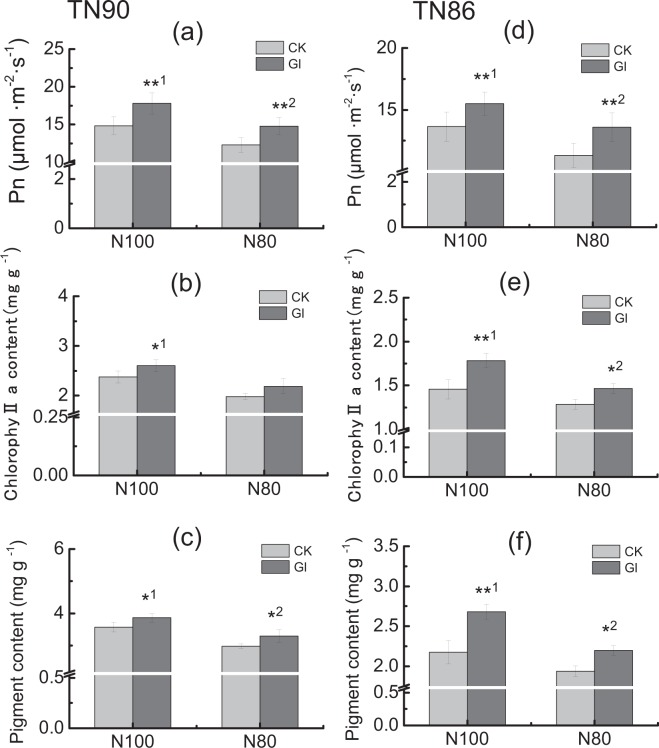
Figure 5.
Effect of pigment content and photosynthesis rate by spraying glycerol under different nitrogen conditions (a,d) Pn (b,e) Chlorophyll a (c,f): Pigment. CK: control; Gl: glycerol. Pn: photosynthesis rate. Error bars of photosynthesis rate indicate standard error of the means (N = 6, “N” means the number of individuals), and error bars of chlorophyll a content and pigment content indicate standard error of the means (n = 3, three biological replicates). Symbols ** 1and * 1indicate that the significant differences between treatment of control and treatment of spraying glycerol under sufficient nitrogen condition (N100) are at 0.01 and 0.05, respectively. Symbols ** 2and * 2indicate that the significant differences between treatment of control and treatment of spraying glycerol under 20% less nitrogen application condition (N80) are at 0.01and 0.05, respectively (a–c) TN90 (d–f), TN86.

