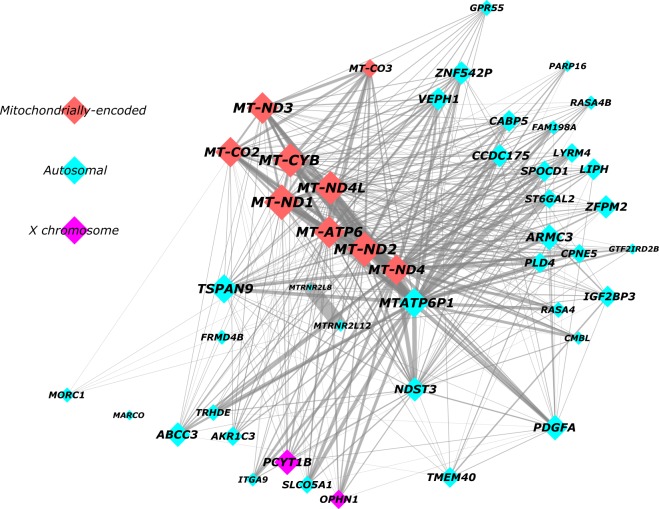
Fig. 2. Network graph summarising the royalblue co-expression module.
The royalblue module was visualised according to a prefuse force directed layout based on weighted correlations between genes. Minor manual changes to node placement were made to maximise clarity. The size of each node (and node label) reflects absolute module membership (MM) values, with larger nodes corresponding to higher MM values. Node colour indicates whether royalblue genes were encoded by autosomal (azure), X chromosome (purple), or mitochondrial (red) DNA. Edge width reflects the weighting of connections between nodes, with thicker edges corresponding to stronger connections

