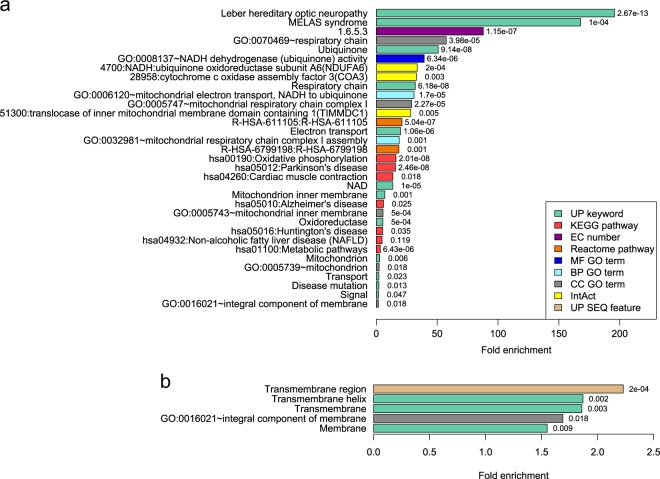
Fig. 3. Enrichment analyses of royalblue module genes.
Bar charts summarising two significant functional annotation clusters indicating enrichment of a mitochondrial-related genes and b genes encoding membrane proteins. Fold enrichment of individual terms within each cluster is indicated by bar length, and corresponding uncorrected p-values are indicated to the right of each bar. Note the difference in fold enrichment scale between a and b panels. UP uniProt, KEGG kyoto encyclopaedia of genes and genomes, EC enzyme commission, GO gene ontology, MF molecular function, BP biological process, CC cellular component, IntAct molecular interaction database, SEQ sequence annotation

