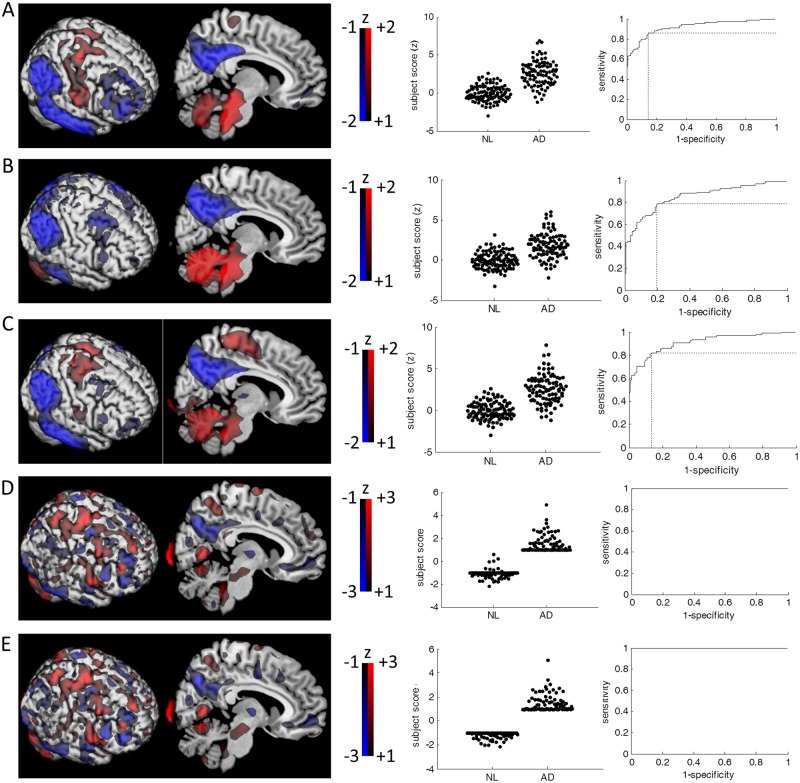
Figure 1.
Visualization of classification machines. (A) Beta coefficient of voxel-wise linear regression (left). Subject scores are defined as the dot-product between the Beta coefficient map and the subject’s proportionally scaled FDG-PET images. The subject scores are z-scored to the mean and standard deviation of normal subjects (middle). Receiver-operating-characteristic (ROC) curve analysis is performed to estimate the area-under-the-curve (AUC; 0.922). The optimal subject score threshold for group classification is determined (z = 0.987) at the biggest sensitivity (0.862) × specificity (0.856). (B) In SSM/PCA1, the topography was similar to the GLM’s beta-coefficient map (left). The subject scores of the first PC (middle) produced the greatest separation of the groups (z-threshold = 0.771, AUC = 0.852, sensitivity = 0.787, specificity = 0.802; right). (C) The combined PCs of SSM/PCA2 was topographically similar to both GLM’s beta coefficient map and the first PC (left). The PCs were weighted by stepwise regression coefficients that significantly improved the model (p < 0.05). The resulting combined PC was 4.204 × PC1 + 0.865 × PC2 + 1.126 × PC3 – 1.825 × PC4 + 1.470 × PC5 + 1.099 × PC7 + 1.118 × PC10. The group separation by subject scores (middle) were relatively better than SSM/PCA1 of the first PC (z-threshold = 1.101, AUC = 0.911, sensitivity = 0.819, specificity = 0.865; right). (D) The hyperplane constructed by SVM-ISDA was topographically distinct from GLM or SSM/PCA (left). While complete group separation was achieved (AUC = 1; right), 3 of 111 NL subjects were labeled as AD (middle). It should be noted, in SVM’s case, that no score threshold is determined by ROC curve, but the sign of dot-product between hyperplane and subjects FDG-PET image (proportionally scaled) determines the labelling. (E) The hyperplane constructed by SVM-SMO (left) was topographically similar to the SVM-ISDA’s. Complete group separation was achieved (middle/right). For visualization purposes, all images are z-scored to the mean and standard deviation of all the voxel values of the whole-brain.

