Figure 5.
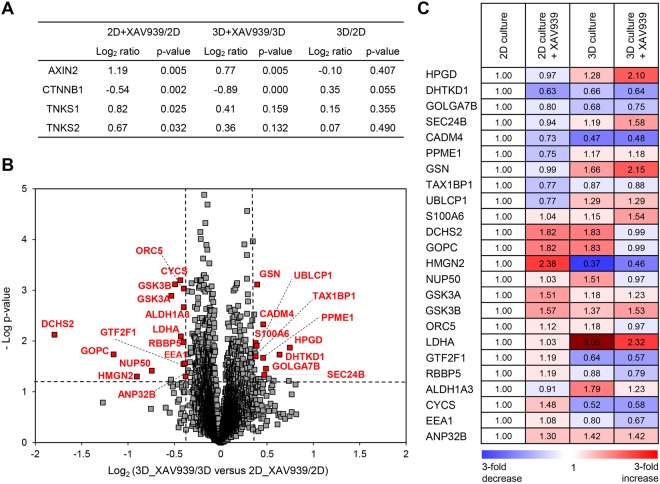
Proteomic comparison of the XAV939-induced changes in 2D- and 3D-cultured SW480 cells. (A) iTRAQ ratios of AXIN2, CTNNB1, TNKS1, and TNKS2 in 2D culture treated with XAV939/2D culture, 3D culture treated with XAV939/3D culture and 3D culture/2D culture. P-value was calculated with student’s t-test. AXIN2, axin-2; CTNNB1, β-catenin; TNKS1, tankyrase 1; TNKS2, tankyrase 2; ACTB, β-actin. (B) Volcano plot of quantified proteins for 3D culture treated with 20 μM XAV939/3D culture versus 2D culture treated with 20 μM XAV939/2D culture. The vertical dashed lines represent 1.3-fold change, and the horizontal dashed line indicates a p-value of 0.05. Significantly changed proteins are shown as red dots with gene names in the plot. (C) Relative protein expression levels of 24 proteins that were significantly changed between 2D- and 3D-cultured SW480 cells in response to XAV939. Values are expressed as fold changes from iTRAQ data and protein expression levels were normalized to 2D culture.

