Figure 6.
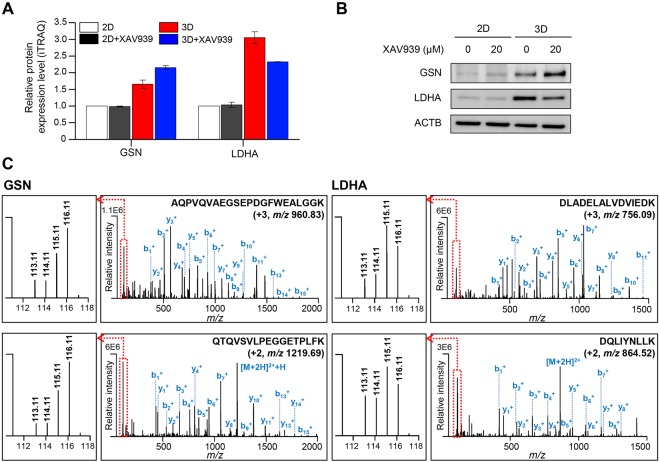
Validation of GSN and LDHA. (A) Relative protein expression levels of GSN and LDHA from iTRAQ data. Results are expressed as fold change, and protein expression levels were normalized to 2D culture. Values are shown as the means ± SEM. GSN, gelsolin; LDHA, lactate dehydrogenase A. (B) Validation of GSN and LDHA in 2D- and 3D-cultured SW480 cells either treated or untreated with XAV939 using western blot analysis. Full-length blots are presented in Supplementary Fig. S4. (C) Representative MS/MS spectra of AQPVQVAEGSEPDGFWEALGGK and QTQVSVLPEGGETPLFK for identified GSN and DLADELALVDVIEDK and DQLIYNLLK for identified LDHA. Left boxes represent spectra of iTRAQ reporter ions. 113.11, 2D culture; 114.11, 2D culture treated with XAV939; 115.11, 3D culture; 116.11, 3D culture treated with XAV939.

