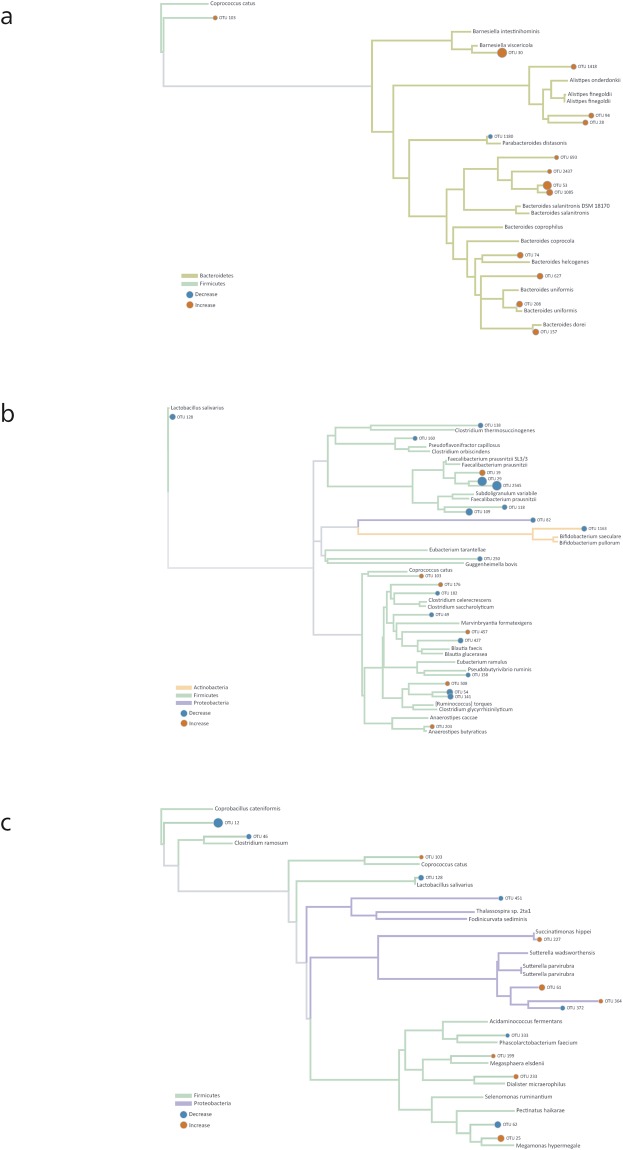
Figure 5.
(a–c) Phylogenetic trees of OTUs from all 4 datasets identified as significant when comparing Control and MRF supplemented BCC. The orange circles represent OTUs that were more abundant in the MRF supplemented BCC, and blue circles represent OTUs that were less abundant in the MRF supplemented BCC. The size of the circles is directly proportional to the magnitude of the abundance. All of these OTUs were considered to be significant features by ERF. Panel a shows the order Bacteroidales OTUs with Coprococcus catus as the outgroup. Panel b shows the orders Clostridiales, Bifidobacteriales, and Bdellovibrionales with Lactobacillus salivarius as the outgroup. Panel c shows the orders Burkholderiales, Aeromonadales, Selenomonadales, Erysipelotrichales, Lactobacillales, and Kiloniellales with Coprobacillus cateniformis as the outgroup.

