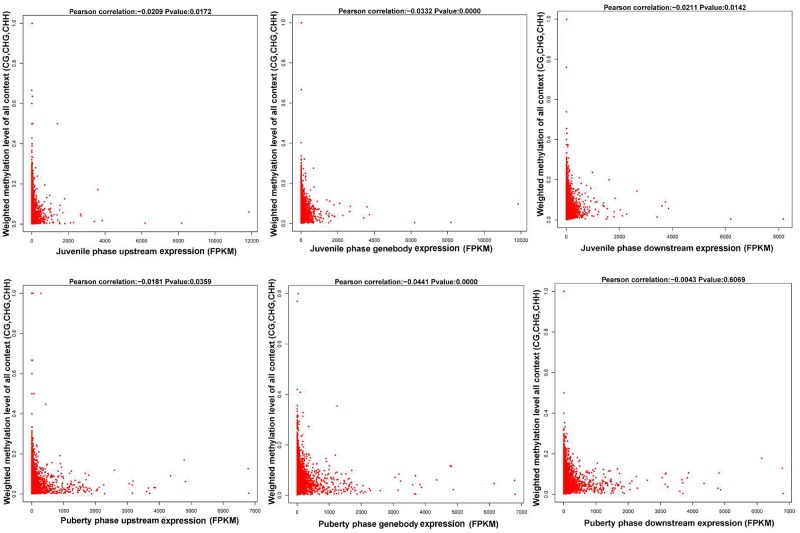
Figure 4.
Correlation analysis between gene expression and its methylation distribution.The first row is the juvenile phase and the second row is the puberty phase of Jining Gray goats. The left column of this figure is the methylation level of the gene upstream region, the medial one is the gene body region and the right one is downstream of the gene. All the data are indicative that the methylation level of DMR genes correlates negatively with their expression levels (Pearson's r < 0, P < 0.05 for juvenile; and Pearson's r < 0, P < 0.05 for puberty).

