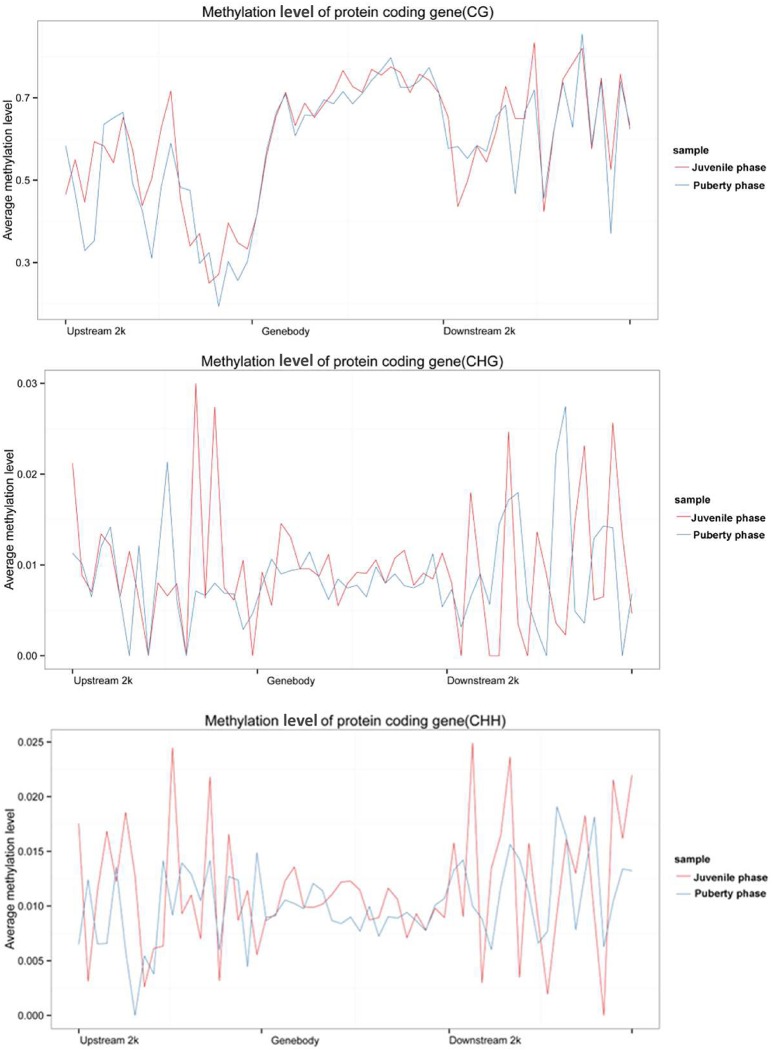
Figure 5.
Analyzed DEGs average methylation levels in the upstream, gene body, and downstream regions of the genes. Upper image is the CG methylated pattern, the gene body region shows a higher level of DNA methylation than the 5′and 3′ flanking regions of genes. The DNA methylation level decreased dramatically proximal to the TSS, increased sharply toward the gene body region and plateaued until the downstream. Additionally, its level in puberty phase is lower than that in juvenile phase. The medium and bottom images are CHG and CHH patterns, respectively.

