Fig. 1.
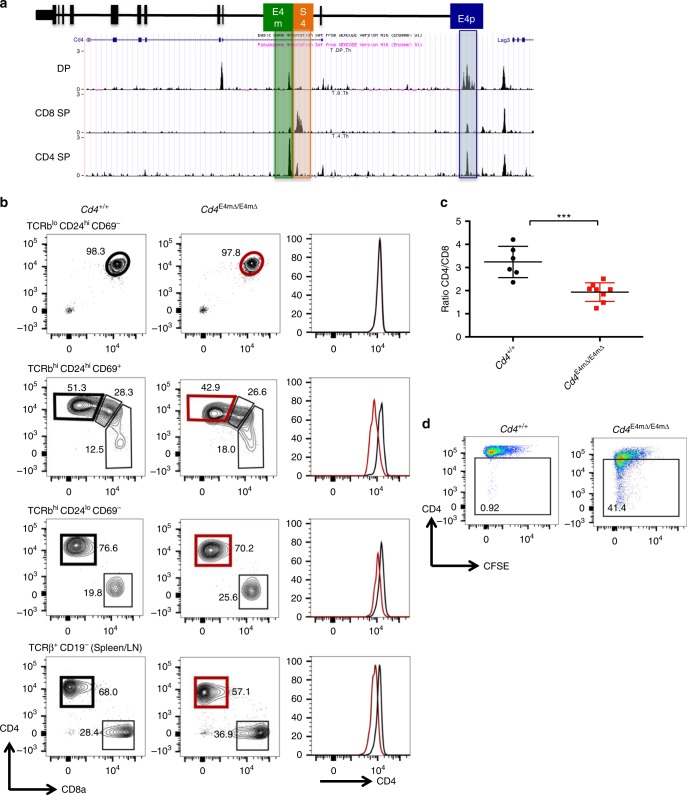
E4m regulates Cd4 expression in recently selected and mature CD4+ T cells. a Schematic structure of the Cd4 locus showing the positions of the Cd4 proximal enhancer (E4p), the Cd4 silencer (S4), and the Cd4 “maturity” enhancer (E4m). Juxtaposed below are genome browser views from ImmGen ATAC-seq datasets from DP, CD8 SP, and CD4 SP thymocytes, respectively. Highlighted boxes show the accessibility of E4m, S4, and E4p. b Contour FACS plots showing CD4 and CD8 expression and histograms on the right showing CD4 expression in cell subsets within indicated gates (in black and red) from the thymus and periphery of WT littermates and Cd4 E4mΔ/E4mΔ mice. Numbers in the FACS plot quadrants indicate cell percentages. Representative results of more than three independent analyses. c Graph showing the ratio of CD4 to CD8 T cells isolated from the spleen and lymph nodes of WT littermates and Cd4 E4mΔ/E4mΔ mice. Mean + SD. ***p < 0.001(unpaired Student's t-test); data are the summary of three independent experiments. d FACS plots showing CD4 expression and CFSE dilutions over cell divisions 5 days after in vitro activation with anti-CD3/anti-CD28 of sorted naive CD4+ T cells from mice with indicated genotypes. Numbers in the indicated gate represent cell percentages. Data are representative of more than three independent analyses

