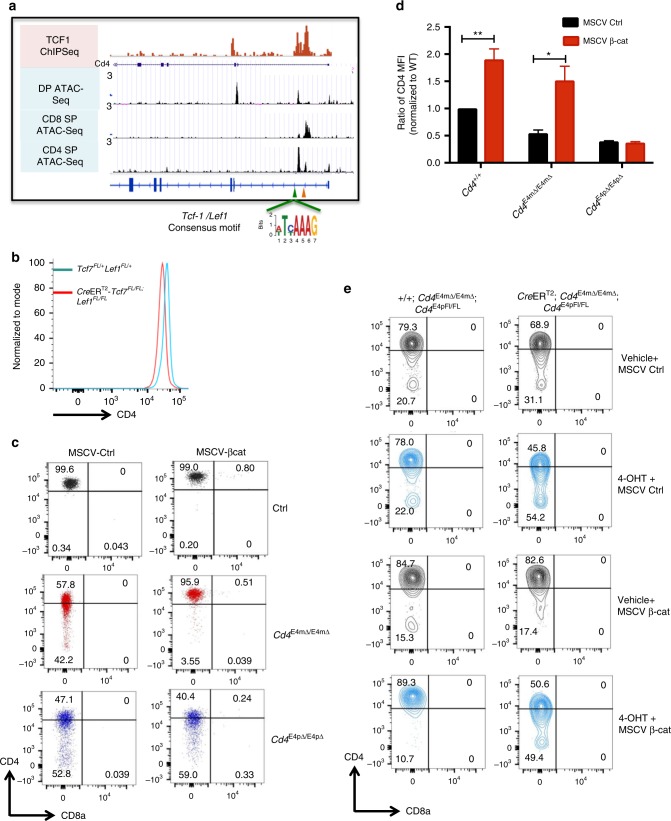
Fig. 4.
Tcf7 and Lef1 control Cd4 expression in mature CD4+ T cells in a β-catenin-dependent manner. a ChIP-seq dataset of TCF1 in thymocytes (Geo accession GSE46662) juxtaposed onto genome brower views of ImmGen ATAC-seq datasets from DP, CD4 SP, and CD8 SP thymocytes. E4m and S4 are indicated by green and orange arrows, respectively. Consensus TCF1/LEF1 motif sequence found within E4m is highlighted. b Histogram showing CD4 expression on sorted TCRβ+CD4+ splenocytes from mice with the indicated genotypes after treatment with tamoxifen. Cells were treated for 4 days, and isolated 4 days after the last treatment. Data are representative of three independent experiments with multiple mice. c FACS plots showing CD4 expression on sorted CD4+ T cells from mice with the indicated genotypes after transduction with MSCV IRES-GFP or MSCV-beta-catenin-IRES-GFP vectors. Cells were analyzed for CD4 expression 5 days post transduction. Data are representative of two independent experiments. d Graph showing the quantification of CD4 MFI on activated T cells from mice with the indicated genotypes, as shown in the representative FACS plots in c. Data are a summary of two experiments done with technical duplicates. MFI values were normalized to MFI of WT cells transduced with the MSCV IRES-GFP control vector. Mean + SD. *p < 0.05, **p < 0.01 (unpaired Student's t-test). e CD4 expression on T cells from mice of the indicated genotypes after transduction with MSCV IRES-GFP or MSCV-beta-catenin-IRES-GFP vectors. Naïve CD4+ T cells from the respective mice were FACS sorted and activated in the presence of 4-hydroxytamoxifen or vehicle control for 24 h prior to transduction. Cells were analyzed for CD4 expression 5 days post transduction. Data are representative of two independent experiments done in duplicates

