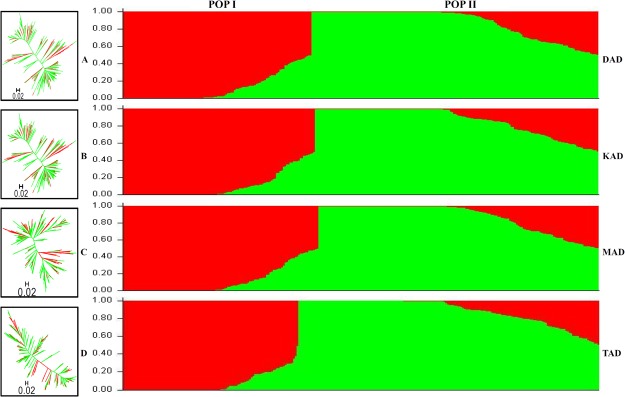
Figure 3.
Unrooted phylogenetic tree and population structure (with population number K = 2) illustrating the evolutionary relationships and best possible population genetic structure, respectively, among 291 desi and kabuli chickpea accessions using 619 DAD (A) 531 KAD (B) 884 MAD (C) and 1083 TAD (D) SNPs. The mapped markers assigned accessions into two populations (POP I and POP II) which essentially corresponded to their geographical as well as cultivar-specific origination. Red and green colours correspond to POP I and POP II, respectively, as defined by both phylogenetic tree and population genetic structure. The accessions represented by vertical bars along the horizontal axis were classified into K colour segments as per their estimated membership fraction in each K cluster.

