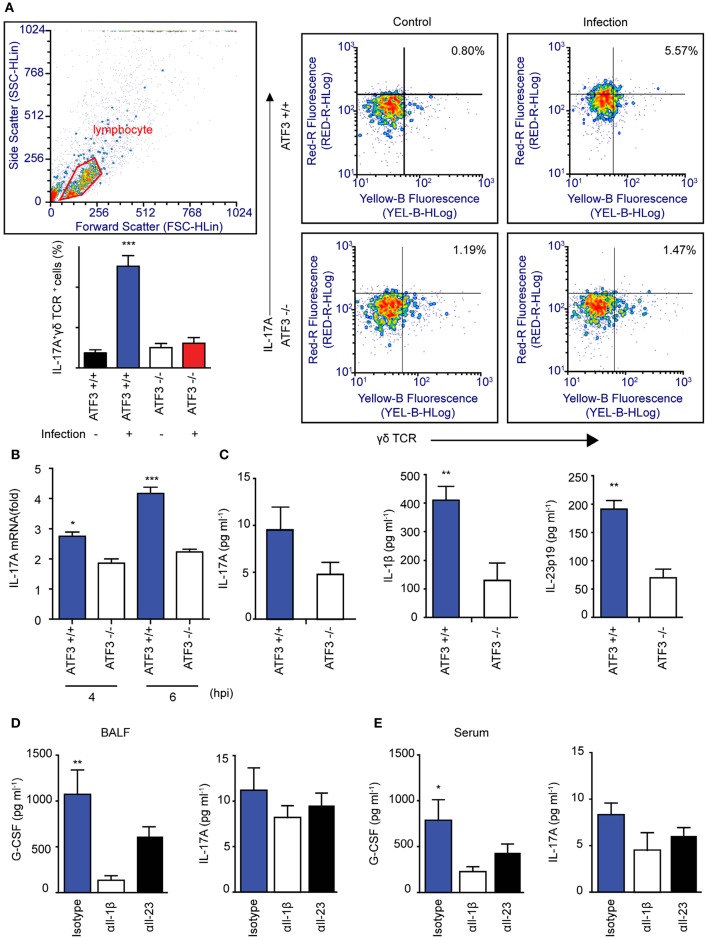
Figure 5.
Association between macrophage ATF3 and γδ T cell IL-17A expression. (A) IL-17A+ γδ+ T cell numbers, (B) Il17a mRNA expression, and (C) IL-17A, IL-1β, and IL-23p19 levels in the lungs of infected mice (n = 4 each) as a fold change relative to that in uninfected mice. (D) Cytokine levels in bronchoalveolar lavage fluid (BALF) samples collected from mice treated with αIL-1β, αIL-23, or isotype control antibody. (E) IL-17A and G-CSF levels in serum (n = 5). Data are presented as the mean ± SD of triplicate samples from at least three independent experiments. *p < 0.05, **p < 0.01, ***p < 0.001, two-way analysis of variance.

