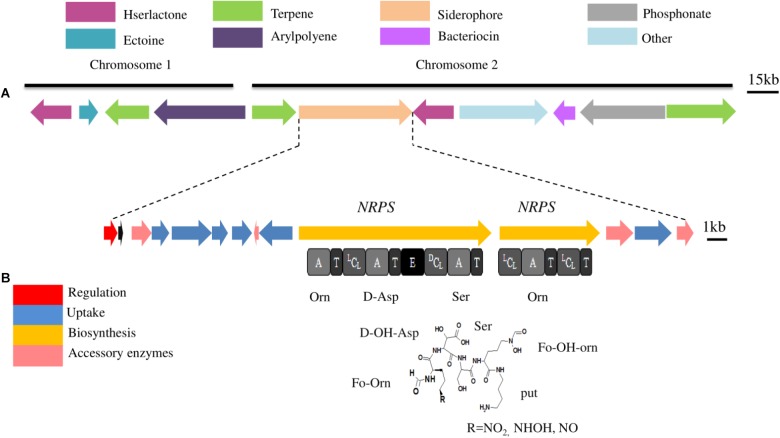
FIGURE 3.
(A) Secondary metabolite gene clusters predicted in the genome of P. phytofirmans PsJN. These gene clusters have been predicted using Florine workflow (Esmaeel et al., 2016b). Each color of gene clusters represents a different class of metabolites. Clusters were located in chromosomes 1 or 2 and some clusters are present in both chromosomes. (B) Siderophore gene cluster located in chromosomes 2. Gene implicated in the synthesis are represented by arrows. The domain organization of the NRPS genes is shown below arrows. A, Adenylation domain; LCL, condensation between 2 L-monomers; DCL, condensation between D-monomer and L-monomer; E, Epimerization domain; T, Thiolation domain. Predicted amino acid specificity is shown under each A domain, Asp, aspartic acid; Ser, serine; hfOrn, hydroxyformylornithine.

