
FIGURE 1.
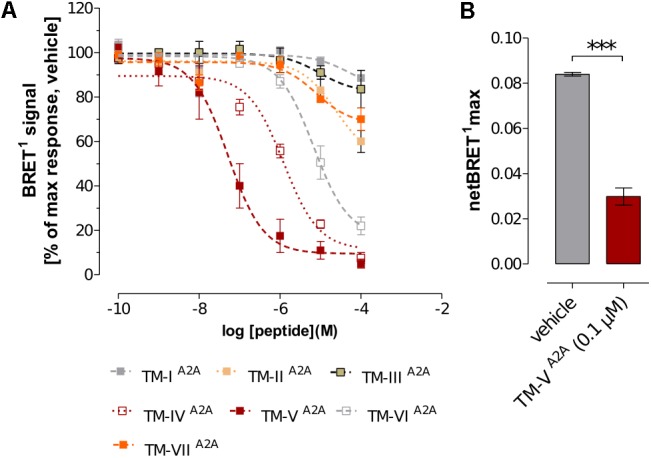
Effects of A2AR TM peptides on A2AR–D2R interactions. (A) The concentration-response effect of the individual A2AR TM peptides (TM-IA2A to TM-VIIA2A) on BRET1 signals of A2AR–D2R heteromers. Values represent percentages of maximal BRET1 responses in cells co-transfected with a 1:1 ratio of D2RRluc and A2ARY FP (1 μg cDNA each). Data are averages ± SEM; n = 6 experiments, 6 replicates (A2AR TM peptides I-III and V-VII); n = 6–10 experiments, 6 replicates (A2AR TM peptide IV). (B) Comparison of the effects of TM-VA2A peptide with the vehicle group on the netBRET1 max values obtained from BRET1 saturation curves for the A2AR–D2R heteromers. Co-transfected cells were incubated with 0.1 μM of TM-VA2A peptide or vehicle and studied by BRET1 saturation assays. Data are averages ± SEM; n = 4, eight replicates. ∗∗∗(TM-VA2A) significantly different compared to vehicle (P < 0.001) by unpaired t-test.