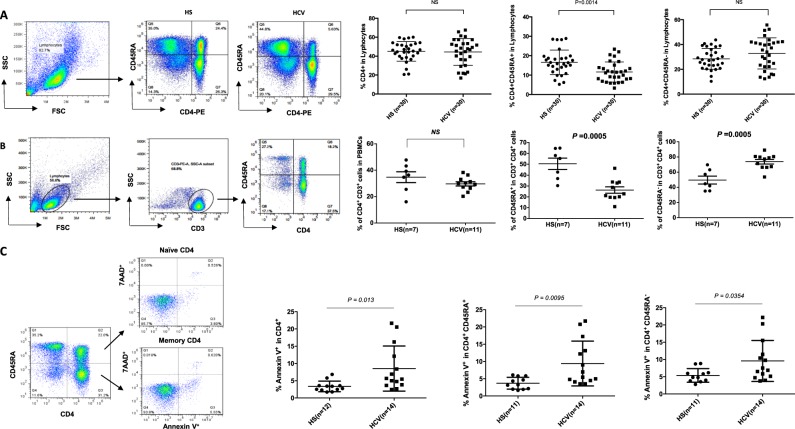
Fig. 1. T-cell homeostasis and apoptosis in HCV-infected patients versus age-matched HS.
a T-cell homeostasis analysis by flow cytometry. Representative dot plots and summary data for percentages of total CD4+, CD45RA+CD4+ naïve, and CD45RA-CD4+ memory T-cell frequencies within PBMCs from 24 HCV patients and 24 HSs. Each symbol represents one subject. Data are expressed as mean ± SE. NS nonsignificant. b T-cell homeostasis analysis by flow cytometry. PBMCs were first gated on lymphocytes, then CD3+ T cells, and subsequently CD4+CD45RA+ naïve and CD4+CD45RA- memory T cells from 11 HCV patients and 7 HSs. c PBMCs isolated from 14 HCV patients and 11 HSs were analyzed for Av and 7AAD expression by flow cytometry. Representative dot plots and summary data for the percentages of cell apoptosis are shown. Given the data normality distribution, total CD4 Av is shown as median with interquartile range, and its P-value was calculated by nonparametric test; naïve and memory T-cell Av is shown as mean ± SE, P-value was calculated by t-test

