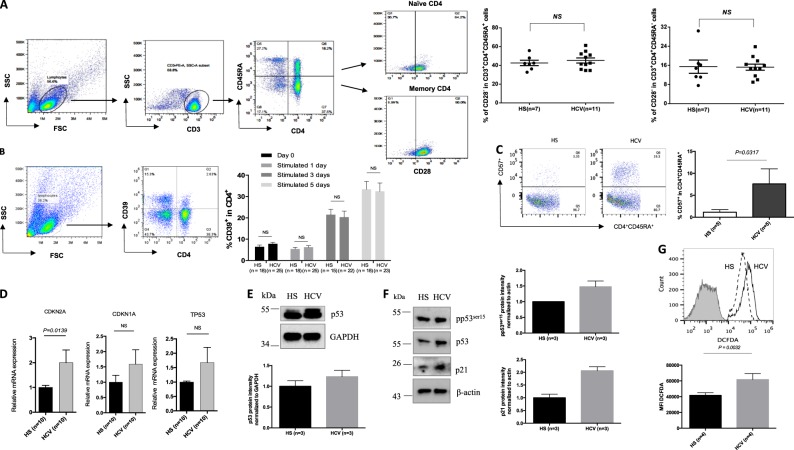
Fig. 2. T-cell senescence in HCV-infected patients versus age-matched HS.
a CD28 expression on CD3+CD4+CD45RA+ naïve and CD3+CD4+CD45RA- memory T cells from 11 HCV-infected patients and 7 age-matched HSs. The gating strategy and summary data of the flow cytometry analysis are shown. Each symbol represents one subject. NS non significant. b CD39 expression in T cells from HCV patients and HS. PBMCs isolated from HCV subjects and HSs were cultured in the presence of anti-CD3/CD28 for 0, 1, 3, 5 days, followed by flow cytometric analysis for CD39 expression on CD4+ T cells. Representative dot plots and summary data are shown. c CD57 expression in naïve T cells from HCV patients and HS. PBMCs were stimulated with anti-CD3/CD28 for 3 days and then analyzed for CD57 expression on CD4+CD45RA+ naïve T cells isolated from five HCV patients and five HSs. d mRNA expression of CDKN2A (p16), CDKN1A (p21), and TP53 in naïve CD4 T cells isolated from 10 HCV patients and 10 HSs. The purified CD4+CD45RO− naïve T cells were analyzed by real-time RT-PCR for p16ink4a, p21cip1, and TP53 mRNA expression. Values were normalized to GAPDH expression and are presented relative to HS. e Western blot analysis for p53 expression in naïve CD4 T cells isolated from HCV patient and HS. GAPDH serves as a loading control. Representative WB imaging and summary densitometry data are shown. f Western blot analysis for pp53, p53, p21 expressions in TCR-stimulated naïve CD4 T cells isolated from HCV patient and HS. β-Actin is used as loading control. Representative WB imaging and summary densitometry data are shown. g Measurement of ROS level in naïve CD4 T cells. Naïve CD4 T cells were isolated from HCV patients and HS and subjected to ROS measurement using the DCFDA-based Cellular ROS Detection Kit. Representative overlaid histogram and summary data for the MFI of DCFDA level in naïve CD4 T cells from HCV patients and HS are shown (n = 4)

