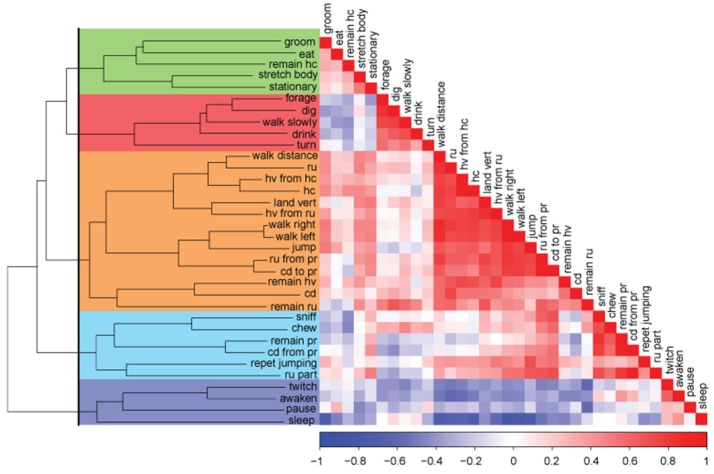
Figure 1.
Correlation matrix-based hierarchical clustering of activities of mice recorded on both, continuous and intermittent, paradigms. Color spectrum of the graph represents positive correlations (in red) to no correlation (in white) to negative correlation (in blue) between individual activities. Dendrogram on the left groups together activities based on their dissimilarities in a bottom-up approach. The black line that cuts through the dendrogram separates the activities into five clusters (represented by colors: green, red, orange, turquoise, and blue).

