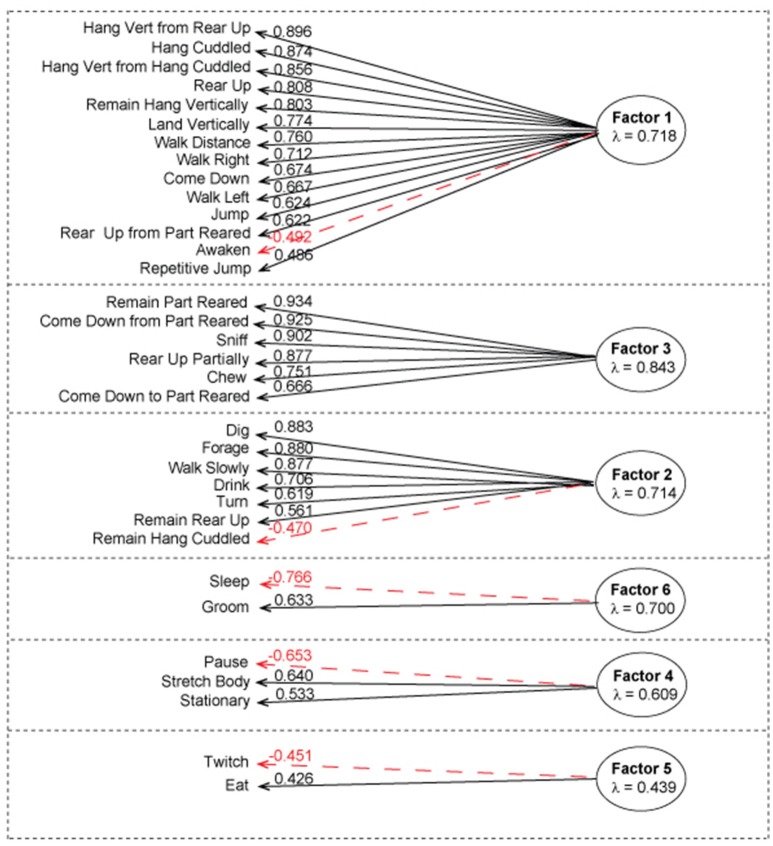
Figure 2.
Factor analysis of the complete dataset using first order factor model. According to parallel analysis, six factors were selected for the factor analysis. The above diagram represents factor loadings on behavioral activities with the corresponding λ values. Positive correlations with the corresponding λ value loading are represented in black. Negative correlations with corresponding value loading are represented in red. Average λ of absolute values is under each factor heading. Factor one contained 14 activities that associated with physically demanding activities, factor 3 contained 6 activities associated with exploratory-like activities, factor 2 contained 7 activities associated with Habituation-like activities, factor 4 contained 3 activities associated with pre/post rest activities, factor 5 contained 2 activities associated with eating and twitching, factor 6 contained 2 activities associated with grooming and sleeping.

