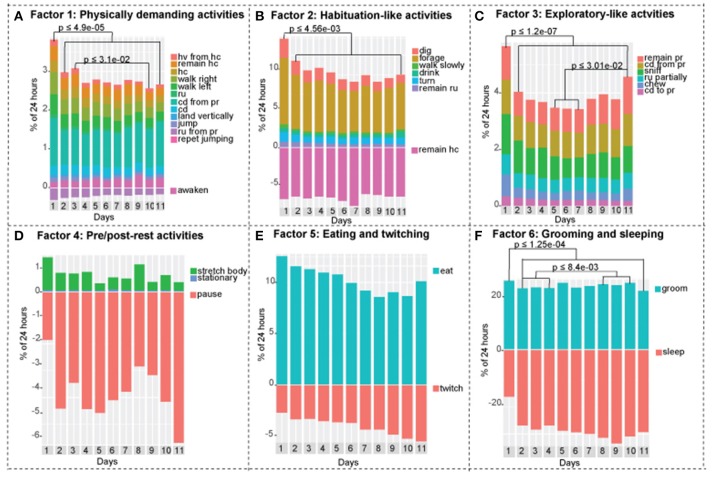
Figure 4.
Activities of the continuously recorded mice separated into factors. Negative y-axis in factor 1, 2, 4, 5, and 6 represents inverse relationships. (A) Factor 1: physically demanding activities. Day 1 is statistically different from days 2-3-4-5-6-7-8-9-10-11, day 3 is statistically different from day 10. (B) Factor 2: habituation-like activities. Day 1 is statistically different from days 2-3-4-5-6-7-8-9-10-11. (C) Factor 3: exploratory-like activities. Day 1 is statistically different from days 2-3-4-5-6-7-8-9-10-11. Day 11 is statistically different from days 5-6-7. (D) Factor 4: pre/post-rest activities. There are no statistical differences between days. (E) Factor 5: eating and twitching activities. There are no statistical differences between days. (F) Factor 6: grooming and sleeping activities. Day 1 is statistically different from days 2-3-4-5-6-7-8-9-10-11, days 2-3-4 are statistically different from days 8-9-10. One-way ANOVA followed by Tukey Honest Significant Difference (HSD) test was used. Adjusted p value is presented on each graph accordingly. n = 8.

