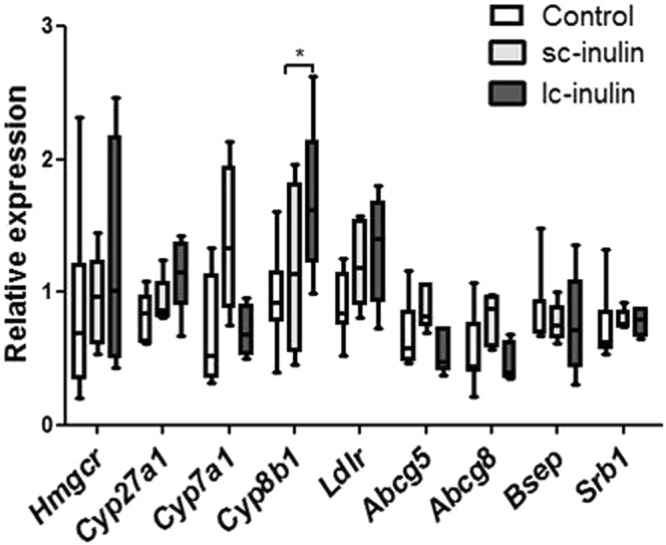
Figure 3.

Hepatic gene expression in mice fed sc- and lc-inulin. At day 14 livers were excised and stored at −80 °C for later analysis. Quantitative real-time PCR was carried out as described in methods. Individual genes are expressed as a ratio to the expression of the housekeeping gene cyclophilin. Data are presented as box plots showing median (interquartile range) and min/max; at least n = 6 for each group. Statistically significant differences are indicated as *P < 0.05.
