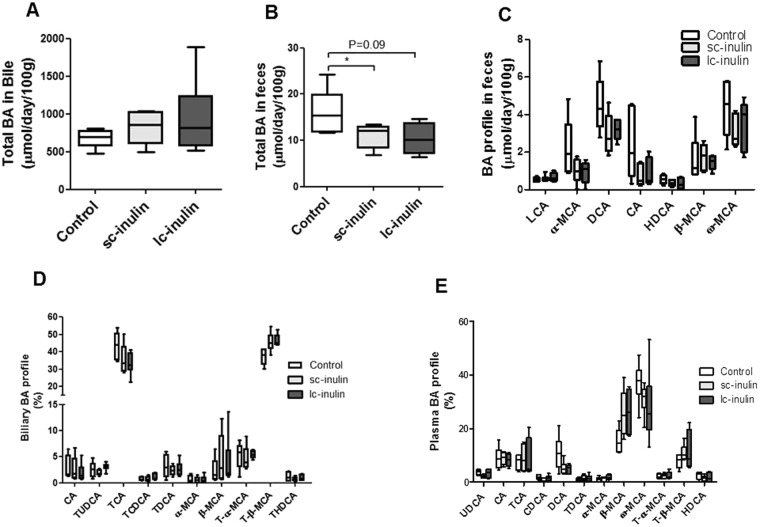
Figure 5.
Sc- and lc-inulin induce subtle shifts in bile acid profiles. (A) Total biliary BA secretion; (B) total fecal BA excretion; (C) BA profile in feces; (D) Biliary BA profile and; (E) Plasma BA profile. At day 14 plasma, fecal and bile samples were collected and processed for bile acid analysis as detailed in methods. Data are presented as box plots showing median (interquartile range) and min/max; at least n = 6 for each group. Statistically significant differences are indicated as *P < 0.05, **P < 0.01. Abbreviations: ω-MCA, ω-muricholic acid; β-MCA, β-muricholic acid; α-MCA, α-muricholic acid; CA, cholic acid; CDCA, chenodeoxy-cholic acid; LCA, lithocholic acid, DCA, deoxycholic acid; UDCA, ursodeoxy-cholic acid; HDCA, hyodeoxycholic acid; T-BA, taurine-conjugated bile acids.

