Fig. 2.
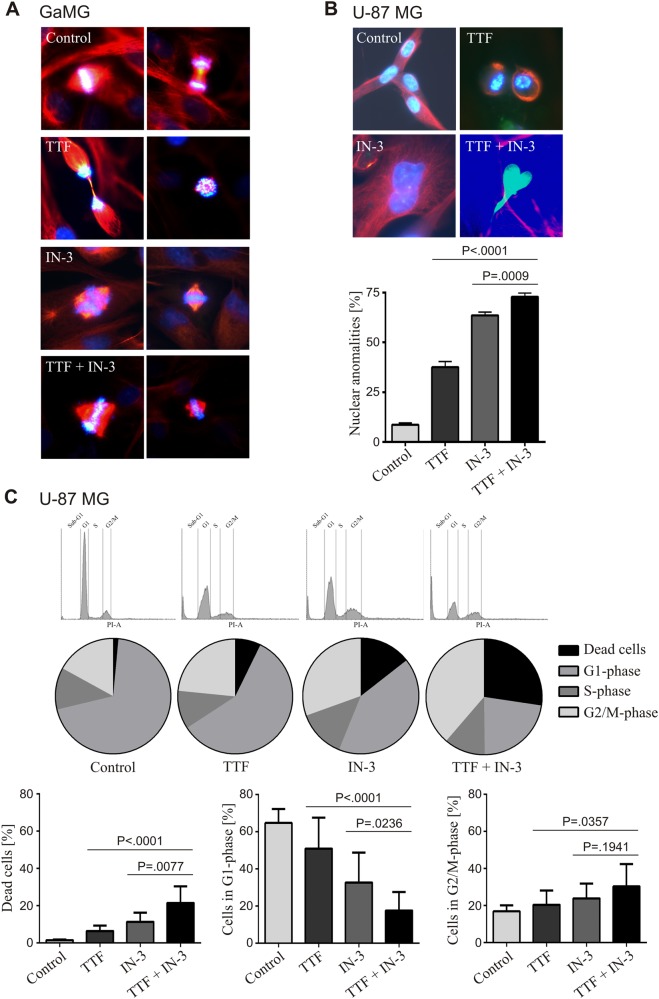
TTFields in combination with MPS1-inhibition affect the cell cycle and cause multipolar spindles and chromosomal missegregation. a Representative fluorescence images of typical mitotic figures of GaMG cells. The different treatments are indicated. Blue: DAPI, green: γ-tubulin, red: α-tubulin. b Representative fluorescence images of nuclear abnormalities (top) and their quantification (bottom) of U-87 MG cells. A total of n = 3 independent experiments were performed and of each experiment 100 nuclei were counted per treatment group. c Distribution of U-87 MG cells to the different cell cycle phases measured by FACS analysis (PI-staining). Histograms (top), average percentage distribution (middle) and percentage of cells in the sub-G1- (dead cells), G1- and G2/M-phase of the cell cycle are shown (n = 12). SD is shown as error bars

