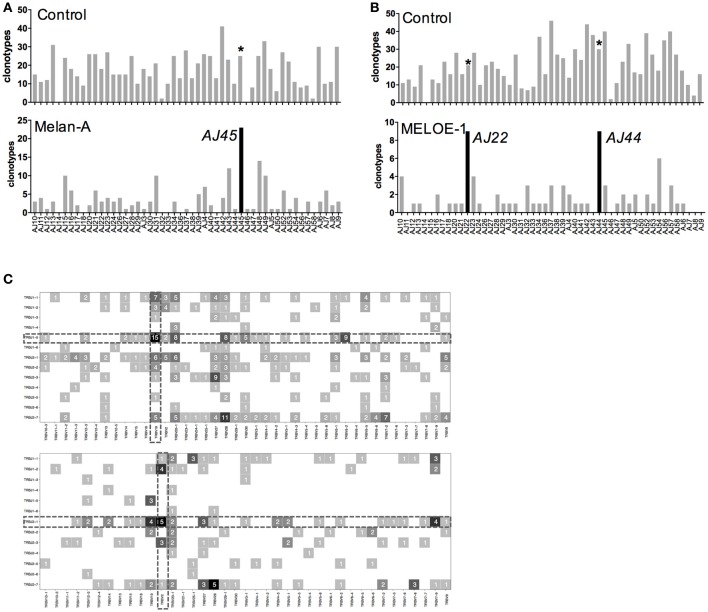
Figure 4.
TRAJ and TRBJ usage of specific-T cell populations. (A) Number of TRAV-12-2 clonotypes using individual TRAJ in the control sample and Melan-A specific T cell repertoire. (B) Number of TRAV-19 clonotypes using individual TRAJ in the control sample and MELOE-1 specific T cell repertoire. Black histograms illustrate TRAJ chains preferentially used in each T cell repertoire, and the same chains are marked with an asterisk in the control sample. (C) Heatmaps of TRBV-TRBJ combination usage for Melan-A (upper panel) and MELOE-1 (lower panel)-specific T cell repertoires. Numbers of clonotypes using a given combination are indicated in the corresponding square.

