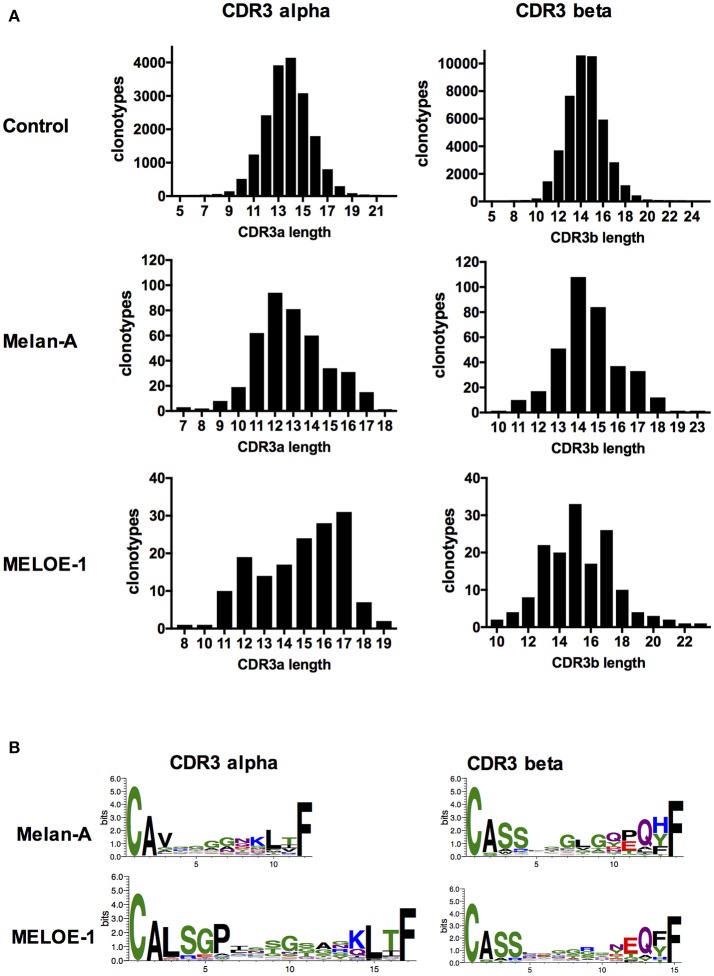
Figure 5.
CDR3α and CDR3ß lengths and sequence composition of the most abundant CDR3 lengths. (A) Amino acid length distribution of CDR3a (left panel) and CDR3ß (right panel) clonotypes, from the control sample and antigen-specific populations. (B) Logotypes of amino acid CDR3α (left panel) and CDR3ß (right panel) composition for the most abundant lengths, for antigen-specific T cell clonotypes.

