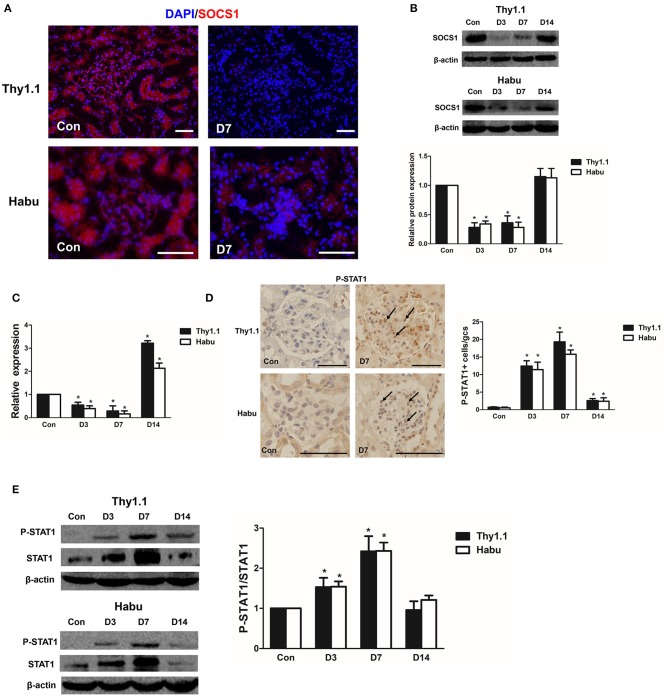
Figure 4.
SOCS1 and STAT1 expression in MsGN models. (A) Immunofluorescence analysis was performed to determine SOCS1 expression in Thy1.1 and Habu GN glomeruli (Thy1.1: magnification × 200; Habu: magnification × 400). (B) SOCS1 protein expression in Thy1.1 and Habu GN glomeruli. Quantitative analysis of SOCS1 protein expression in glomeruli of MsGN models. (C) Quantitative RT-PCR analysis of SOCS1 mRNA expression in glomeruli of MsGN models. (D) Immunohistochemistry analysis of P-STAT1 in Thy1.1 and Habu GN kidney sections. Representative micrographs and quantification of positive cells in glomeruli are shown (original magnification, × 400). (E) Western blot analysis of P-STAT1 and STAT1 expression in Thy1.1 and Habu GN glomeruli; representative images and the summary of the normalized quantification are shown. Data are presented as the mean ± SEM (n = 10 per group). The results are representative of three independent experiments. *P < 0.05 vs. Con. Con: non-nephritic phosphate-buffered saline (PBS)-treated animals. Scale bar = 50 μm.

