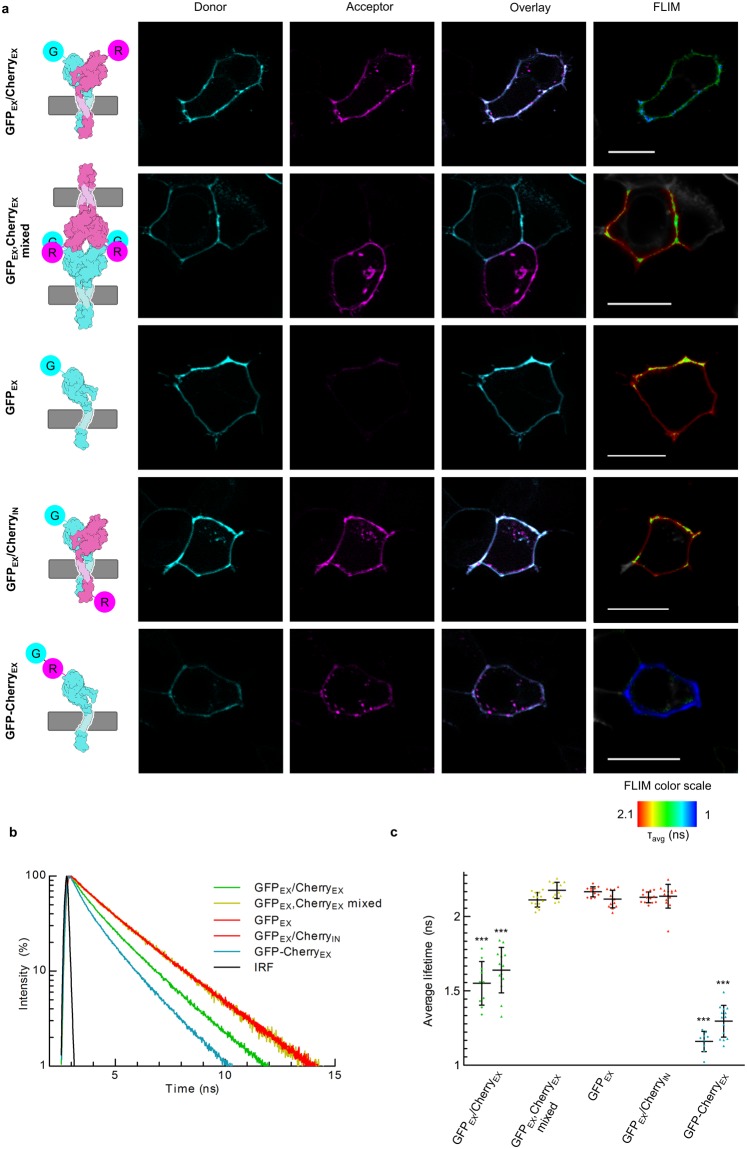
Figure 5.
FLIM-FRET (HEK 293 T). (a) Analysed combinations of fluorescently tagged EpCAM proteins. sfGFP (G) fluorescence is colored cyan and mCherry (R) fluorescence is colored magenta. The same color scheme applies to schematic representations on the left. White line represents 20 µm. FLIM color scale is the same in all presented FLIM measurements. (b) Representative fluorescence lifetime decays for each analysed combination. (c) Mean lifetimes with s.d. of all analysed combinations. For each combination, results obtained in HEK 293 T cells are presented on the left and results obtained in HCT8EpCAM− on the right, ***p < 0.001, one-way ANOVA test with Bonferroni post hoc analysis, compared to mean values of negative controls. Color scheme is the same as in figure b.

