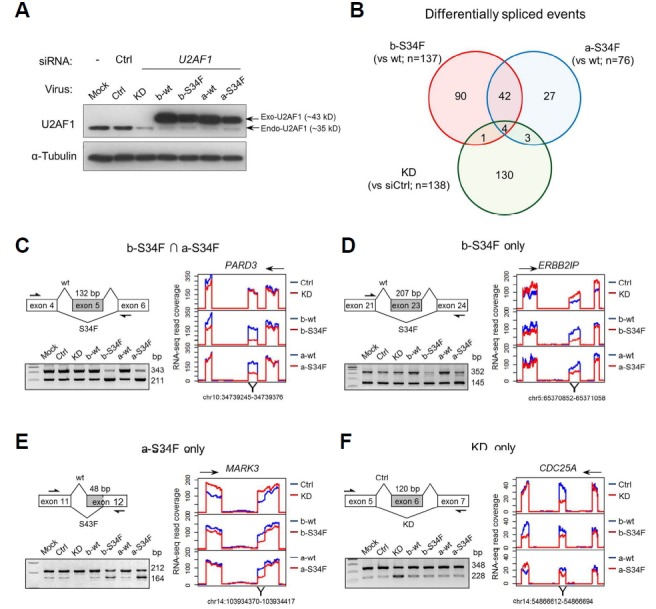
Fig. 1. KD and mutant expression lead to distinct AS events.

(A) Immunoblot showing KD of endogenous U2AF1 and expression of exogenous wt and S34F mutant U2AF1. Ctrl indicates control empty vector virus infection. (B) Venn diagram of genes showing AS upon KD or mutant expression. Note the limited overlap between KD and mutant expression in contrast to expression of the two mutants. (C–F) Representative cases of AS from the four indicated gene set categories. The alternatively spliced exon and surrounding exons are diagrammed. Arrows indicate oligonucleotide primers used for RT-PCR shown below. To the right are RNA-seq read coverage of the diagrammed exons. Directions of transcription are indicated above. Note the similarity in AS induced by the two U2AF1 splice variants.
