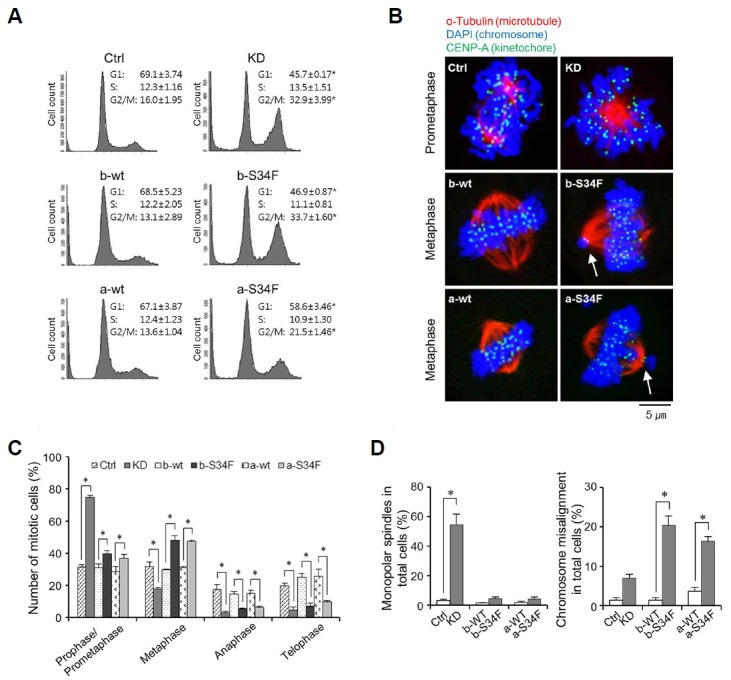
Fig. 4. KD and mutant expression lead to mitotic stress at distinct stages.

(A) Flow cytometric analyses of cell cycle progression. Note that both KD and mutant expression induce G2/M arrest. Results are average ± standard error of the mean (SEM) of three independent assays. (*) represents P-value of < 0.05 compared to control condition. (B) Representative images of cells after KD and mutant expression in the affected sub-stages. Note that after KD, centrosomes are not separating even though chromosomes are condensed. Also note that not all chromosomes (white arrows) are aligned in the center after mutant expression during metaphase. (B, C) Mitotic sub-stage distribution of cells after KD and mutant expression. Cells with condensed chromosomes with microtubules extending from centrosome are grouped together as prophase/prometaphase cells. Cells with centrosomes in opposite ends with chromosomes aligned in the middle are considered metaphase cells. Cells showing mitotic spindle-mediated chromosomal migration are considered anaphase cells. Note that KD results in accumulation of cells in prophase/prometaphase and decrease in fractions of cells in all subsequent stages while mutant expression increases the fraction of cells in metaphase and decreases those in anaphase and telophase. Results are average ± SEM of three independent assays. (*) represents P-value of < 0.05 compared to control condition. (D) Fractions of cells with monopolar spindles after KD and of cells with misaligned chromosomes after mutant expression (b and a) are shown. Results are average ± SEM of three independent assays. (*) represents P-value of < 0.05 compared to control condition.
