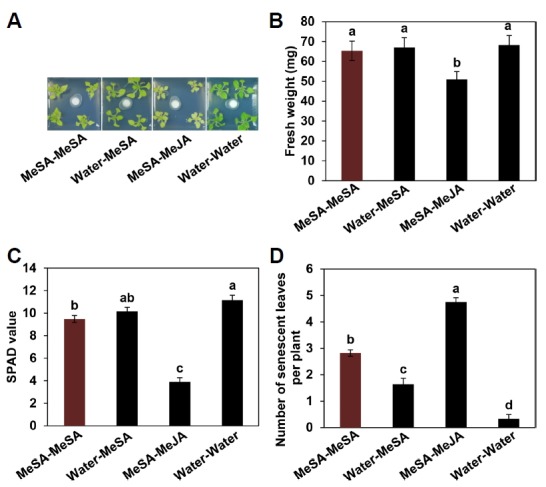
Fig. 3. Measurement of plant physiological parameters after repeated applications of MeSA.

Representative photographs of plants taken at 7 days after the second application of MeSA (A). Plant physiological parameters such as weight (B), chlorophyll content (SPAD value measured with chlorophyll meter) (C) and leaf senescence (D) were measured at 7 days after the second exposure to MeSA (6 weeks). Bars represent the mean ± SE (sample size, n = 16 replications per treatment). Different letters indicate significant differences between treatments (P = 0.05 according to least significant difference). The experiment was repeated three times with similar results.
