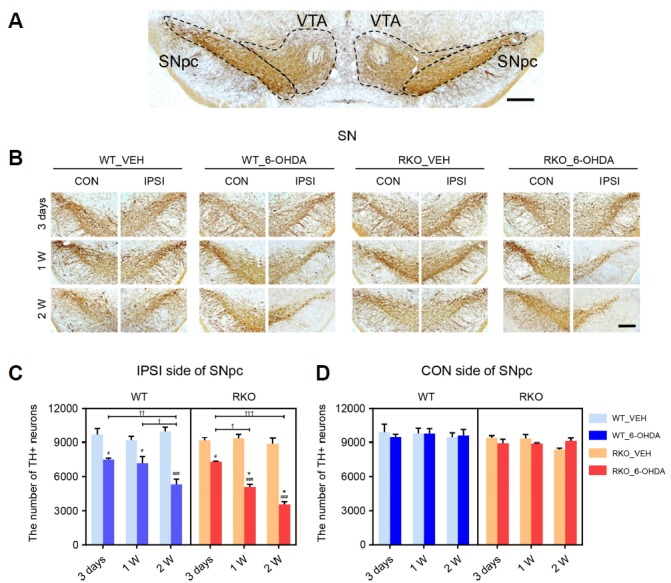
Fig. 2. Dopaminergic neuronal loss in the substantia nigra pars compacta (SNpc) induced by 6-hydroxydoapmine (6-OHDA) is accelerated and intensified in Rev-erbα knockout (RKO) mice.

(A) Photomicrograph showing the border separating SNpc and ventral tegmental area (VTA) of tissue sections immunostained for tyrosine hydroxylase (TH). Scale bar = 200 μm. (B) Three days, 1 week, and 2 weeks after intrastriatal 6-OHDA injections, coronal brain sections containing the SNpc were immunolabeled using anti-TH antibody. Scale bar = 200 μm. (C, D) Stereological counting of TH+ neurons in each (C) ipsilateral (IPSI) or (D) contralateral (CON) side of the SNpc using 6 slices per animal. Data are presented as mean ± standard error. N = 3–5 per group. Two-way analysis of variance was followed by Tukey’s post-hoc test; #p < 0.05, ###p < 0.001 versus VEH-injected group; *p < 0.05 versus WT mice; †p < 0.05, ††p < 0.01, †††p < 0.001 among different time points.
