Figure 3.

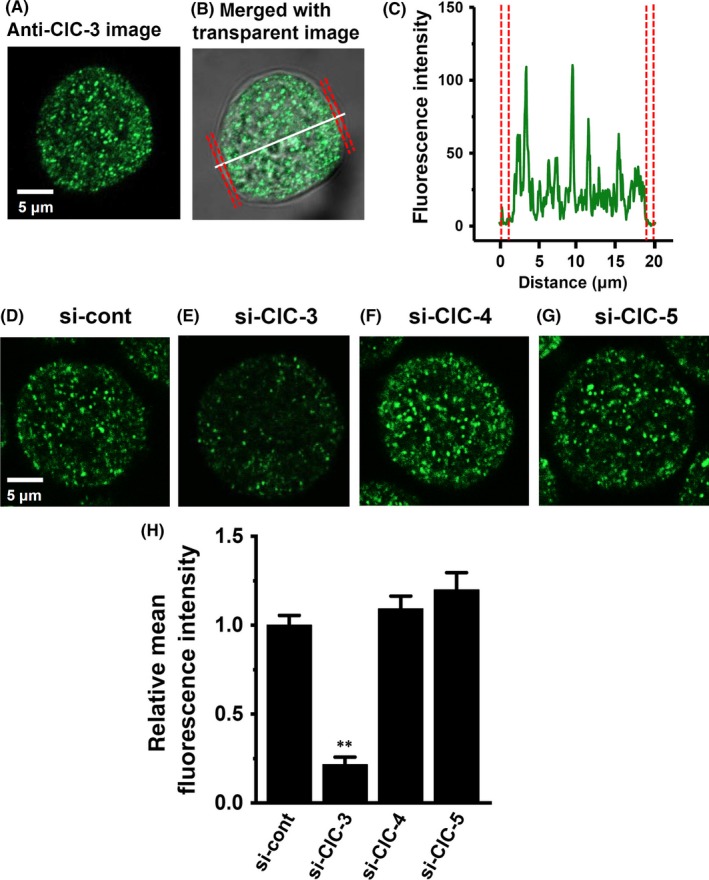
Cellular distribution of ClC‐3 in MDA‐MB‐453 cells. (A‐C) Immunocytochemical staining of MDA‐MB‐453 cells for ClC‐3. A, Confocal images of a cell labeled with anti‐ClC‐3 and Alexa Fluor 488 anti‐rabbit IgG antibodies. B, a fluorescent image merged with a transparent image. C, the profile of fluorescence intensity on the white dotted line in (B) is shown in “green”. The plasma membrane is shown in ‘red’. D‐H, ClC‐3 fluorescent images in control siRNA (si‐cont) (D)‐, ClC‐3 siRNA (si‐ClC‐3) (E)‐, ClC‐4 siRNA (si‐ClC‐4) (F)‐, and ClC‐5 siRNA (si‐ClC‐5)‐transfected MDA‐MB‐453 cells for 72 h. Mean fluorescent intensity in the si‐cont group was expressed as 1.0 (n = 24 for each); summarized data are shown in (H). Results are expressed as means ± SEM. **P < .01 vs si‐cont
