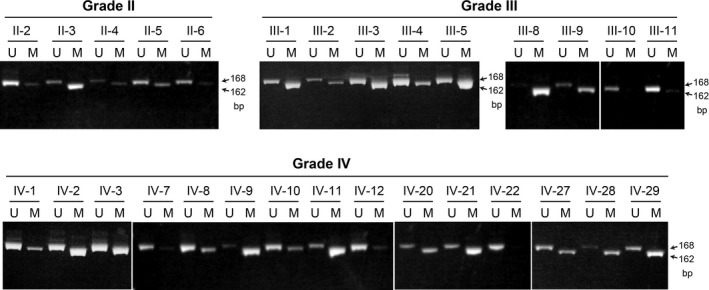
Figure 4.

Results of methylation‐specific PCR analysis of SPINT2 in human glioma tissues. Representative data of grade II, III, and IV gliomas are shown. Positions of unmethylated (U; 168 bp) and methylated (M; 162 bp) bands are indicated by arrows

Results of methylation‐specific PCR analysis of SPINT2 in human glioma tissues. Representative data of grade II, III, and IV gliomas are shown. Positions of unmethylated (U; 168 bp) and methylated (M; 162 bp) bands are indicated by arrows