
Figure 4.
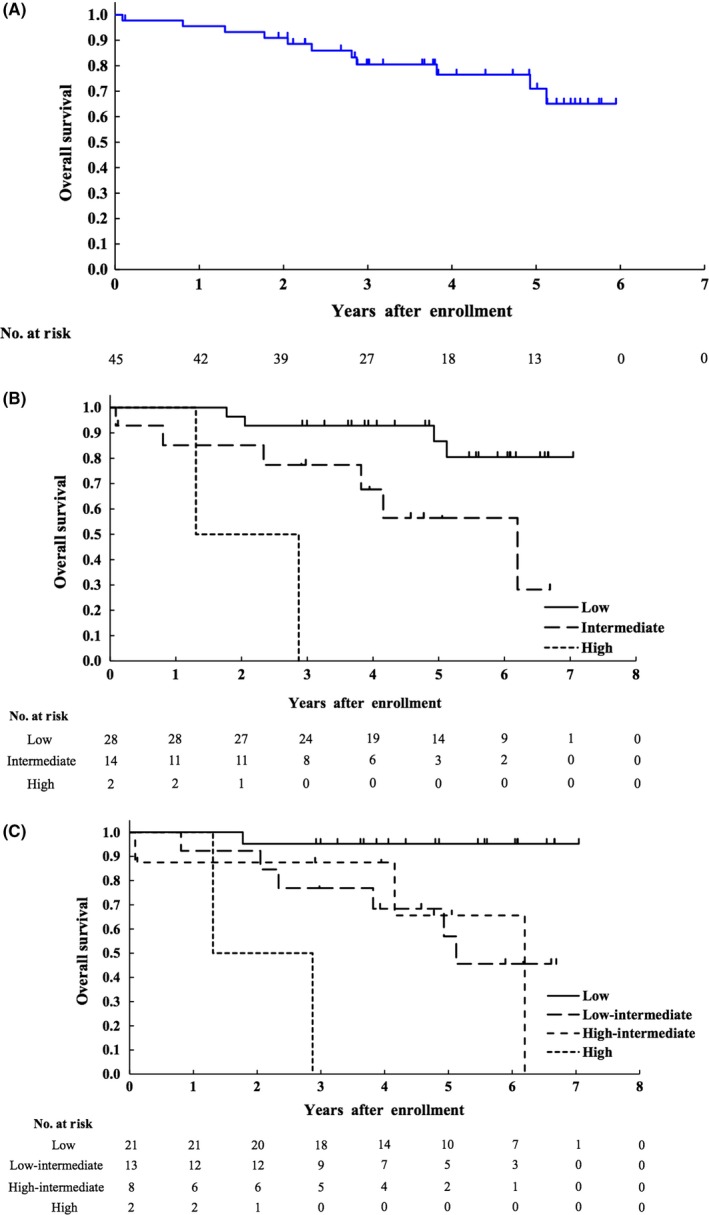
Kaplan‐Meier curves of overall survival (OS) (A) of all 45 enrolled patients, and Kaplan‐Meier curves of OS according to risk stratified by MIPI (n = 44) (B) and MIPI‐c (n = 44) (C). MIPI, mantle cell lymphoma international prognostic index; MIPI‐c, modified combination of the Ki‐67 index and MIPI