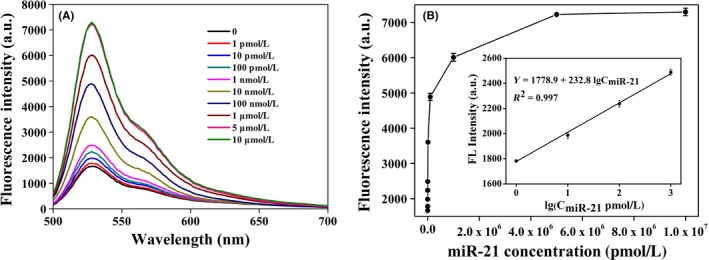
Figure 2.

A, The fluorescence emission spectra for various concentrations of miR‐21. From bottom to top: 0, 1, 10, 100 pM, 1, 10, 100 nM, 1, 5, 10 μM. B, The calibration curve between the fluorescence intensity and the logarithm of concentrations of miR‐21. Experimental conditions: RCA temperature 30°C and RCA time 5 h. The error bars represent the standard deviations of three independent experiments
