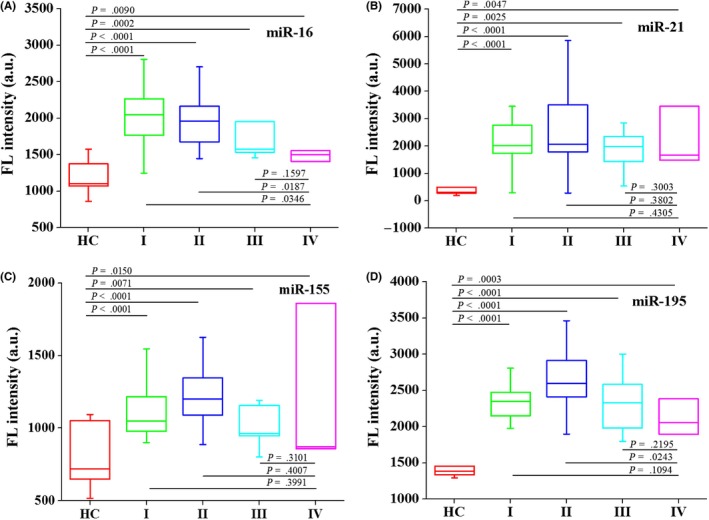
Figure 4.

The levels of serum c‐miR‐16 (A), c‐miR‐21 (B), c‐miR‐155 (C), and c‐miR‐195 (D) compared between healthy controls (n = 15) and breast cancer patients with different histological tumor grades: stage I (n = 12), stage II (n = 20), stage III (n = 6), and stage IV (n = 3). HC, healthy controls; I, breast cancer patients at stage I; II, breast cancer patients at stage II; III, breast cancer patients at stage III; IV, breast cancer patients at stage IV. The F test and Student's t test were performed for comparisons between groups
