
Figure 7.
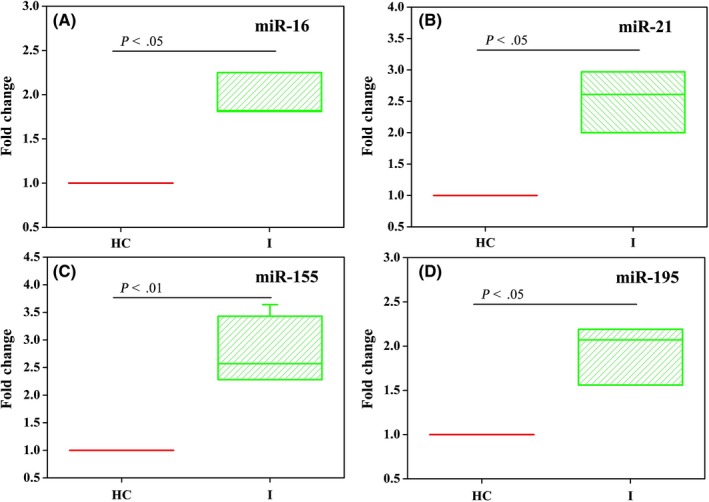
The fold change of c‐miR‐16 (A), c‐miR‐21 (B), c‐miR‐155 (C), and c‐miR‐195 (D) serum levels compared between healthy controls (n = 4) and breast cancer patients at stage I (n = 4). The F test was performed for comparisons between groups
Official websites use .gov
A
.gov website belongs to an official
government organization in the United States.
Secure .gov websites use HTTPS
A lock (
) or https:// means you've safely
connected to the .gov website. Share sensitive
information only on official, secure websites.
The fold change of c‐miR‐16 (A), c‐miR‐21 (B), c‐miR‐155 (C), and c‐miR‐195 (D) serum levels compared between healthy controls (n = 4) and breast cancer patients at stage I (n = 4). The F test was performed for comparisons between groups