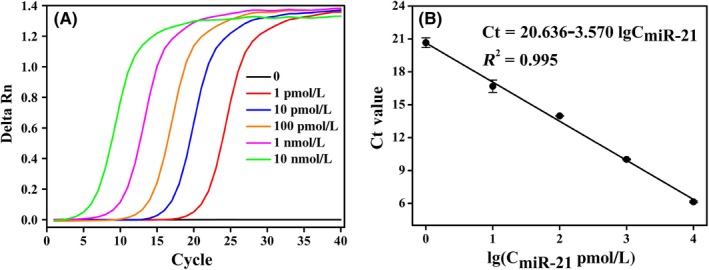
Figure 8.

A, The fluorescence monitoring of quantitative real‐time PCR amplification reaction triggered by various concentrations of miR‐21 (0, 1, 10, 100 pM, 1, 10 nM). B, The calibration curve between threshold cycle value (C t) and the logarithm of the different concentrations of miR‐21. The error bars show the standard deviation of three replicate determinations. C t defined as the fractional cycle number where the fluorescence passes the fixed threshold value
