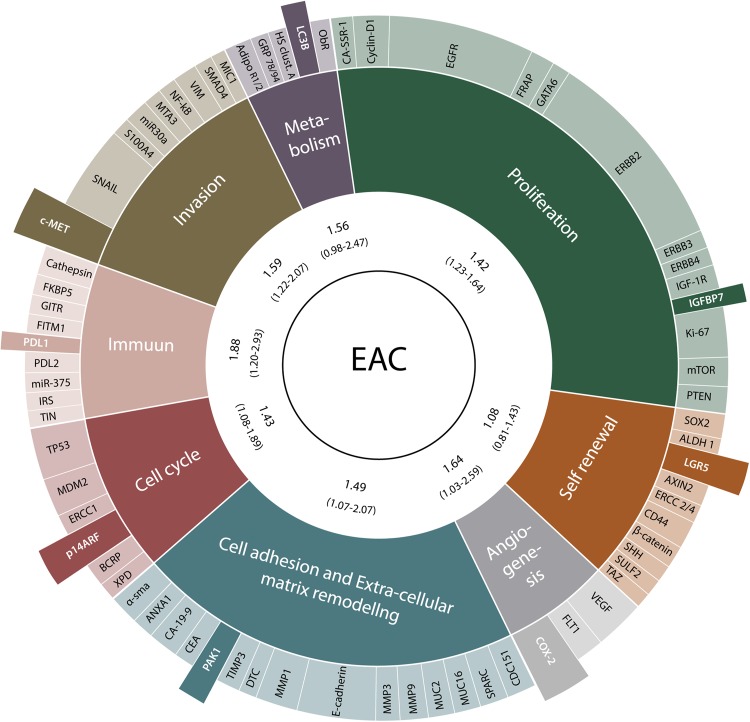
Figure 3.
All identified biomarkers and adapted hallmarks of cancer are summarized in the Ferris Wheel Plot. The area of each adapted hallmark of cancer represents the amount of articles with data on the corresponding hallmark of cancer. The most promising prognostic biomarkers according to our meta-analysis are highlighted. In the inner circle the hazard ratios (HR) and 95% Confidence Intervals (95%CI) are reported for each adapted hallmark of cancer.

