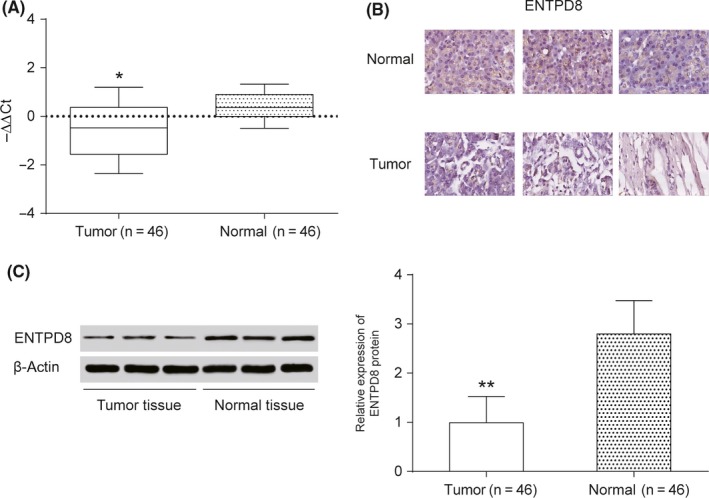
Figure 3.

Expression level of ENTPD8 in pancreatic cancer tissue. A, Quantitative RT‐PCR was undertaken to measure the relative expression level of ENTPD8 mRNA in tumor tissues and normal tissues. B, Immunohistochemical assay shows that ENTPD8 appears positive in the normal cell nucleus. C, Western blot analysis to measure ENTPD8 protein expression level. *P < .05; **P < .01, indicates statistical significance compared with negative group
