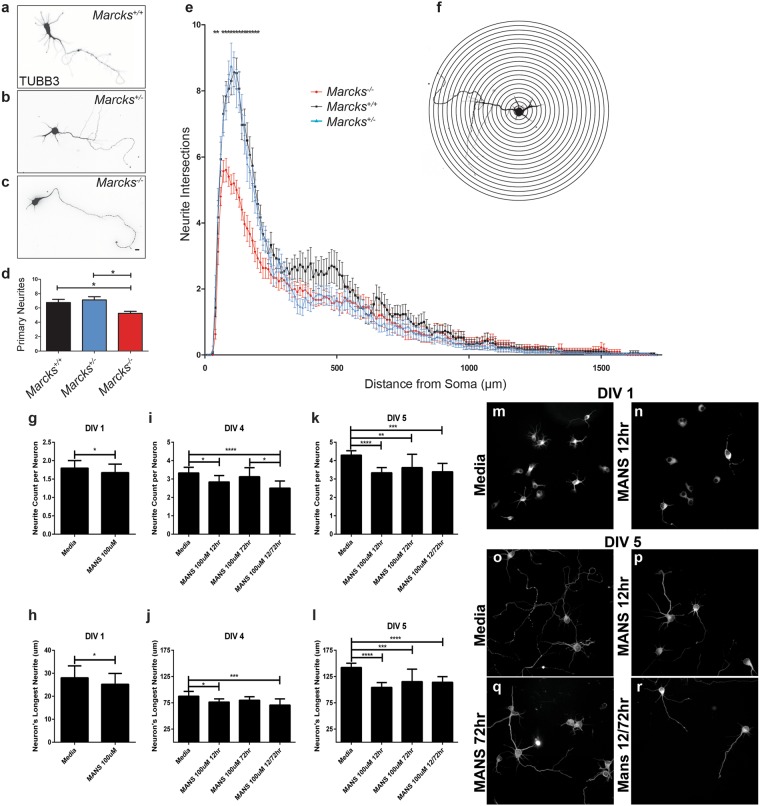
Figure 1.
MARCKS is required for appropriate primary neurite number and neurite arborization. Primary cortical neurons were isolated from Marcks+/+, Marcks−/+ and Marcks−/− mouse embryos and grown for 5 DIV in 2-dimensional culture. Neuronal somas and neurites were visualized with anti-TUBB3 antibodies (a–c) and arborization was mapped and quantified with Sholl analysis (e), which is depicted in a simplified cartoon in (f). Marcks−/− neurons formed significantly fewer primary neurites (d) and had significantly less complex arbors (e) than Marcks+/+ or Marcks−/+ neurons, which were indistinguishable. One-way ANOVA, *p < 0.05 level using post-hoc Tukey’s correction for multiple comparisons. n = 30 (neurons/genotype). High Content Screening was used to quantify neurites per neuron (g,i and k) and measure longest neurite on a neuron (h,j and l) at DIV 1 (g and h), DIV 4 (i and j) and DIV 5 (k and l) in the presence of media only or 100 uM of MANS peptide administered at either 12 hours, 72 hours, or 12 and 72 hours. Bar graphs represent the mean (n = 8–12 wells per condition, with an average of 150 neurons samples per well) with the standard deviation for error bars. Representative images from the High Content Screening showing DIV 1 neurons in media only (m) or with 100 uM MANS peptide added after 12 hours and DIV 5 neurons administered with either media only (o), 100 uM MANS at 12 hours (p), at 72 hours (r), or at 12 and 72 hours (s). Scale bar in (c) is 100 μm. Bar graph and Sholl plot are mean ± SEM.

