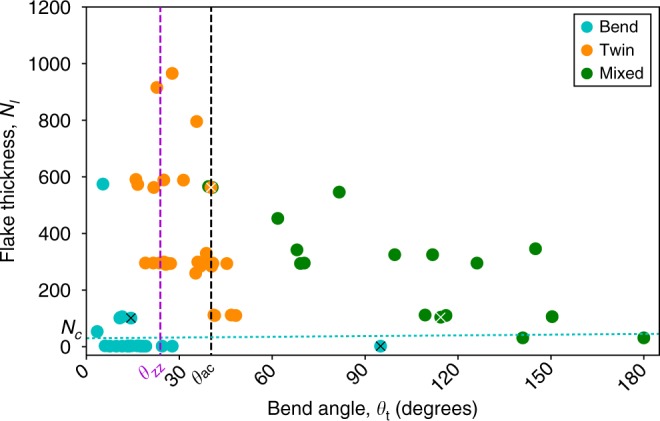
Fig. 4.

Plot of observed bending phenomena in graphite. The plot demonstrates the distribution of ‘Bend’, ‘Twin’ and ‘Mixed’ modes of deformation observed experimentally for different bend angles and thicknesses of crystal for both ac and zz bending. The dashed black and purple lines are the theoretically predicted ideal bend angles θt for ac and zz twins, respectively. The theoretical minimum thickness threshold for the twin or mixed modes is denoted by the dotted blue line. The data-points derived from the illustrative images in Fig. 3 are annotated with a cross. Bend mode (blue data points) are where θ < θt and for any thickness the crystal can accommodate the strain with gentle bending whilst remaining fully commensurate, and also where θ > θt but the flake is sufficiently thin that deformation results in nanotube-like bending of the basal planes. Twin mode (orange data points) is where above a critical flake thickness Nc and around or below θt, discrete twin boundaries are found. The mixed mode (green data points) are where thicker flakes above θt display a third and more complex configuration combining twinning and bending
