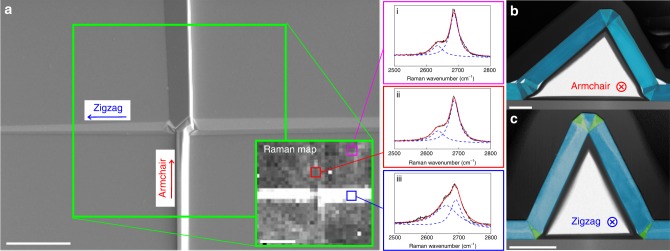
Fig. 5.
Twin boundaries creating unusual Raman-active stacking in graphite. a SEM image of two orthogonal kink bands intersecting in the crystal. Inset maps the Raman intensity ratio of the 2630 cm−1 and 2690 cm−1 peaks in the 2D peak. The ratio is drastically modified locally to the zz kink band (white contrast in inset). Scale bars 10 μm. Individual Raman 2D spectra are shown for (i) pristine graphite, (ii) the ac twin and (iii) the zz twin boundaries. b Large field of view bright field STEM image of the ac kink band. In this striation the basal stacking in each crystalline region is equivalent (Bernal stacked). False colour is used to highlight areas of lattice separated by a twin boundary. This ac kink band shows some delamination yet gives the same 2D Raman signal as pristine graphite. Scale bar 250 nm. c Large field of view bright field STEM image of the zz kink band. Regions of Bernal stacking are false coloured blue while small areas of crystal that do not exhibit Bernal stacking and are instead highly faulted or AA’ stacked are false coloured green. These areas are thought to contribute to the modification of the Raman 2D signal. Scale bar 250 nm

