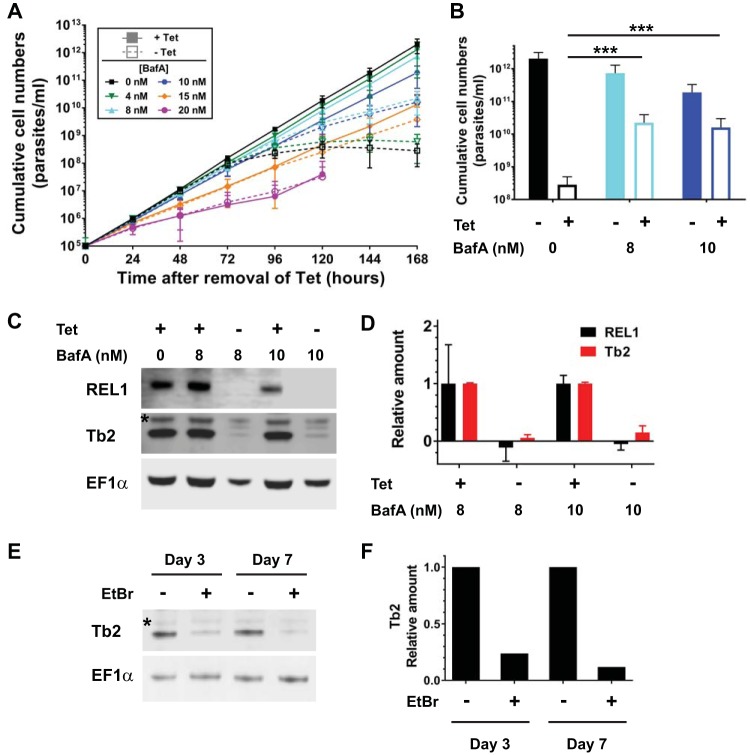
FIG 1.
(A) Cumulative growth curves of T. brucei REL1-cKO BF cells cultured in the presence (filled symbols, solid lines) and absence (open symbols, dashed lines) of 1 μg/ml tetracycline (Tet; required for expression of REL1) and at various concentrations of BafA. Each data point is the average of at least six separate growth curves; error bars indicate the standard deviation (SD). (B) Comparison of cumulative cell numbers (A) after 168 h at 0 nM (n = 6), 8 nM (n = 8), and 10 nM (n = 6) BafA. Statistical significance of differences was assessed with the Wilcoxon rank sum test; P < 0.001 (***) was for noninduced (−Tet) 0 nM BafA versus −Tet 8 nM BafA and versus −Tet 10 nM BafA. (C) Western blot of samples taken at 0, 8, and 10 nM BafA after 168 h, probed with a REL1 antibody. The same blot was probed with antibodies for Tb2, to assess levels of intact F1Fo-ATPase complex (the asterisk indicates a cross-reacting protein), and for EF-1α (Millipore), as a loading control. (D) Quantification of Western blot signals, taking the average of two replicates (one shown in panel C) and indicating relative protein levels under noninduced compared to induced (+Tet) conditions for each BafA concentration (normalized to EF-1α). (E) Western blot of samples from T. brucei BF cells expressing an ATPase subunit-γ allele with the L262P mutation, taken after 3 and 7 days of culturing in the presence of 10 nM EtBr to remove kDNA. Cells grown in the absence of EtBr were used as controls. The blot was probed with antibodies for F1Fo-ATPase subunit Tb2 (the asterisk indicates a cross-reacting protein; see panel C) and for EF-1α as loading control. (F) Relative quantification of the Tb2 Western blot signals shown in panel E (normalized to EF-1α).

